00:00:23.550
I'm extremely honored this year because this is the very first time I've been able to do the opening keynote at RailsConf. Every other year, I always give the final keynote of the conference. This is the very first time I've been able to give the opening keynote at RailsConf, though I do think it is kind of weird that if you go to the website and scroll down, you'll see that I am very last on the webpage.
00:00:37.739
Now, I'm sure this is just a small oversight by the organizing committee, but you know, I'm sure we can get this cleared up later. It's really great to be the very first opening presentation. Now, David usually does the opening keynote, but since it's my turn this year, I thought I should change my headshot to something a little bit more appropriate. So I took a new headshot photo, and this is what I am going to start using from now on when I give talks at places.
00:01:08.130
The other thing is that since I won't be able to see David's presentation ahead of my presentation—and I can't stress this enough, I am the opening keynote this year—since I won't be able to see his talk, I can't make any jokes about it. So I've decided that this year, what I'm going to do is try to guess the things that he'll say and then see if I can make some jokes in advance.
00:01:19.890
The first thing I'm pretty sure he's going to talk about coming in 2020 is that Basecamp is going to be starting a new email service called Haykam. I'm really excited about this, but from what I understand, they plan to monetize the service by charging money for email. I think that's really great, but I don't understand why anyone would pay money for email. People send me email all the time—just constantly—and I don’t pay for any of it, so I'm not sure why people would pay for that. But I wish them the best of luck!
00:01:43.670
The other thing I'm pretty sure of is that most folks are doing a lot more remote working these days, and I think that's really great. I know that there are a lot of people out there who are new to doing remote work. I'm also really happy that David and Jason decided to release this book at such a steep discount; they wrote a book about remote working. I haven't actually read the book yet, but I really plan to. I ordered a copy and I’m going to read about this, and the reason I want to read it is because I, too, would really like to work from home. I mean, I would really like to work from David's home—it looks very nice.
00:02:09.420
Now, as you've no doubt noticed, RailsConf is not in Portland this year due to the outbreak of COVID-19 in the United States, and I'm pretty sad about that. I love going to Portland; it's really too bad. I was looking forward to seeing everybody in Portland this year, and it's so close to Seattle that I can just drive there instead of flying. I really like that! The other thing is that I love that show Portlandia, so I'm so happy that I could visit Portland, which the show is about.
00:02:46.670
But honestly, one of the reasons I think that the show is really funny is because Seattle, where I live, is so similar to Portland, and the show could really be about either place, but I guess Portland got stuck with it. Anyway, as I was saying, we are doing the conference remotely this year; doing a pre-recorded talk is really a difficult thing for me to do.
00:03:05.640
I usually don't do pre-recorded talks. It's really important for me to get feedback from the audience when I'm giving a presentation; that way, I can adjust my presentation if I'm going too long or too short. Also, I get extremely nervous when I'm giving a talk, and the feedback from the crowd helps me actually calm down when I'm on stage.
00:03:36.069
Unfortunately, since I'm pre-recording this, I feel really nervous. But I decided I would try to deal with this by attempting to give a presentation ahead of time and record it in Zoom.
00:03:59.580
All right! You started already? You're muted. Sorry! Can you hear me now?
00:04:05.650
You hear me? All right, sorry about that. Let's try again. Hi everyone, welcome to Aaron's Variety Hour! I'm really happy to be here.
00:04:17.720
I think you give a color palette on your screen still. Oh really? I don't see anything. Wait. Is there? Okay, one sec, one sec. That is—okay, oh yeah, thank you! Okay, okay, let’s do this again. Hi everybody, welcome to Aaron’s Variety Hour! Hopefully, this will be an hour-long presentation. I'm not sure. Can you all mute if you're not speaking? Can you—someone's getting a phone call. Can you mute please?
00:05:14.110
All right. Okay, let me start over. Welcome to Aaron's Variety Hour! I am so happy to be here. Hopefully, this will be an hour-long session. I've been trying to start this.
00:05:42.310
Okay, I will—sorry, sorry! It's okay, it's okay! All right everyone, welcome to Variety Hour! I'm sorry, wrong meeting.
00:06:02.194
Okay, hi everyone! Welcome to Variety Hour. This may be an hour, but I'm not sure.
00:06:10.660
When that didn’t work, I decided that I would try to give the talk in front of my cats. Welcome to RailsConf! Welcome to my very first opening keynote at RailsConf! Come here buddy! Welcome to RailsConf! Come on buddy! Now, when that didn’t work, I decided that I would try to give a presentation on Animal Crossing.
00:07:03.450
Now, before I get into the stuff that I actually want to talk about for this conference, I want to tell you all about my productivity strategy. My productivity strategy is procrastination. So in order for me to focus on building a presentation, I need to put it off until I absolutely can't put it off anymore. The reason I do this is because it gives me a hyper focus.
00:07:28.600
I have to focus on the task since I'm required to focus on it; like I know that there’s a particular deadline. I have to be up in front of an audience, and this helps me really focus on preparing my presentations for people. However, this strategy also comes with a lot of extreme guilt. Now as I'm procrastinating, and I know I should be working on my talk, I know I should be making this presentation, but I'm not.
00:08:34.879
In order to relieve my guilt from procrastination, I have to fill my time with things that I deem to either be more important than the tasks at hand, or it has to be something that's more fun. Now, I call this procrastination project management, or PPM for short, and actually, I take it very, very seriously. In fact, I meticulously plan out my procrastination.
00:09:02.760
These projects are actually planned procrastination projects. Now, I had planned on procrastinating all the way until April and then working on my presentation for all of April until RailsConf came around. Now, unfortunately, we got hit with COVID-19 and RailsConf was canceled, and when that happened, Evan texted me and he asked me, 'Would you be willing to record your presentation?' And, of course, I said yes.
00:09:49.510
So I asked him, 'When is the deadline for this?' because that's how I work. I didn't tell him that this is my productivity strategy, but I need to have a deadline in order for me to procrastinate, and he said, 'Oh yes, the dates will be the same as RailsConf!' I said, 'That is great!' I knew internally, okay, the dates are the same; this means that my procrastination plan is on schedule! Things can move according to plan.
00:11:04.680
Unfortunately, maybe a couple of weeks later, I got an email from the RailsConf organizing committee saying to me, 'Oh, well actually, your videos are due by April 13th.' And unfortunately, this was three weeks earlier than I had planned, so this really, really put a lot of pressure on me. I decided that part of my presentation, since everything is pushed up so far, is I'm going to give a presentation of my planned procrastination projects.
00:11:58.600
So before we actually dive into the technical details of my presentation, I’d like to show you some of the stuff that I've been doing to basically put off doing my actual work. So once I found out that we were going to be doing RailsConf as an online conference, I got really worried. I kept thinking to myself, okay, how am I going to record the video? Now, of course, I need to record it in 4K.
00:12:33.430
Obviously, an iPhone won't do, so I'm going to have to purchase a new camera that can shoot 4K video because it's very important that people are able to see, you know, how dry my skin is or see my face in excruciating detail. So, I decided to purchase a new camera. I got this OMD camera; it's a very nice camera. Then I read the manual for it, and to be honest, I haven't owned an SLR camera in quite a while, so I'm not up on the latest technology.
00:13:50.680
I was incredibly surprised at how you actually have to transfer photos from the camera onto your phone or your computer or whatever. According to the manual, what you do is the camera creates a Wi-Fi network; now you connect to the Wi-Fi network with your phone and then your phone transfers the photos off of the camera via Wi-Fi!
00:14:54.909
So of course, you have to install some kind of proprietary application on your phone—some kind of app to transfer the photos from the camera over to your phone, and this made me think a couple things. First off, I thought, 'Install a new app in this economy? I've got millions of apps on my phone; I can't afford to have another app on my phone!' The other thing that I thought was, 'Can I hack this?' There has to be a way for me to hack my camera.
00:15:37.370
I don't want to transfer all the photos off using some third-party application; I'd rather have a program that takes them directly off of the camera and imports them right into the photos application rather than using some weird thing. So I decided that one of my procrastination projects—since I bought the camera to film the video—I need to be able to get the photos off of the camera or the video off of the camera in order to show the video to everyone.
00:16:26.110
I decided I needed to hack my camera. To get started, I decided to connect my computer to the camera via Wi-Fi rather than my cell phone. When I did, I noticed a couple of interesting things. First, the camera always had the same IP address, so I thought that was very interesting.
00:16:58.319
When I ran a port scan on the computer, I found that it also had an HTTP service open, and that was very interesting. Now I also found that I could just run curl against the HTTP port, and it gave me an error that showed in the terminal. But the traffic was all over port 80, it was unencrypted, and if I could figure out what the actual endpoints were on the camera, maybe I could write my own client for the camera.
00:17:56.180
So I needed a way to figure out, okay, what is the data going between the cell phone and the camera? What are they transferring? What is it doing? If I can figure that out, I can write my own client. I wanted to come up with a way to intercept the data that was being transferred between the camera and the phone. Fortunately, there were a couple of things going for me.
00:18:37.130
The first thing was that we had a hard-coded IP address, so the camera always had the same IP address. That said to me that probably the application that's accessing the camera has that IP address hard-coded in, so I could use this to my advantage. The other thing is that since we have port 80 open and not 443, it's probably going to be unencrypted traffic.
00:19:13.700
So the camera is going to be transmitting unencrypted data. Now, there is one crucial detail—or one important thing—and that is that the point of this exercise is not actually to write a client for the camera, but to put off doing the work that I really need to do. And that means that I need to make this project worthwhile so that I don't feel guilty about it.
00:19:51.940
This gave me one really big constraint, and that is that I needed to either use Ruby or Rails to somehow intercept and deal with this traffic. My idea for getting access to the data that was being transferred between the phone and the camera was to essentially set up two computers that each had two interfaces.
00:20:32.230
So one would have two computers. Each computer would have Ethernet and Wi-Fi. Now, the two computers would be connected to each other via Ethernet, and we would connect the cell phone to one of the computers via Wi-Fi. That computer would act as a proxy, intercepting the traffic and recording it. Then we would connect the camera to the other computer via Wi-Fi and create an SSH tunnel between the camera and the proxy server.
00:21:12.780
This way, our proxy server can access the network for the camera, allowing us to have the two same IP addresses with access to each other. The secondary computer will set up an SSH tunnel between the camera and our proxy server, which allows our proxy server to access the camera through a port on localhost.
00:22:05.270
So when the phone sends data, the proxy server will save a copy of the request, and when the camera responds, the proxy server can save a copy as a response. Something like this: when the phone sends a request, we save a copy of the request, and then the camera sends a response, we save a copy of the response and send that back to the phone.
00:22:51.559
If we record all of that data, we can figure out what the protocol the phone and camera are using to communicate with each other. Now, for completeness, this is the SSH tunnel command that I used, and you can see here, essentially what happens is we say we're going to forward all port 80 on 192.168.0.10 to our Raspberry Pi. I'm using a Raspberry Pi as my proxy server, and the localhost on the proxy server can access the camera on localhost via port 22.
00:23:41.230
So if we connect to 22 on localhost, that'll actually be forwarded over to the camera. Then, in order to make this project worthwhile and make myself feel guilt-free, I wrote the proxy server in Ruby, and essentially, what it is, is just a proxy server written with Webrick. This is the code that handles the GET request for the proxy server.
00:24:14.330
Essentially, all it does is access the SSH tunnel here. So when a request comes in, the proxy server creates a new connection to localhost on port 22, which actually connects to the camera. Then we send the request, replay the request that we got from the phone, we get the response body from the camera, and then we send the response back to the phone, logging all this data along the way.
00:24:56.030
We have to handle posts as well; this is the code for handling posts. It's almost exactly the same as the code for handling GET requests, except that we need to log post bodies as well, so it was very similar. Now, the next thing that I did was that I used the app on the phone to collect data. Now, of course, yes, this did mean that I had to install the application on my phone, but hopefully I installed the application on my phone so that you don't have to.
00:25:32.340
You, too, can buy this camera and not have to install the application. I did it for you, and I am publishing this data so you won't need to do this, hopefully. Anyway, using the data that we were able to collect, that we intercepted on the proxy server, it's pretty trivial to write our own client. This is the client that I wrote for getting photos and images and movies off the camera.
00:26:04.860
Basically, it just has two parts: the top part gets a list of all the images, all the files that are stored on the camera, and the second part downloads all those images. Of course, I added a little bit of intelligence in there so that if we've already downloaded the image, it won't try to download it again. So we did it—our camera's hacked! That is great!
00:26:37.160
Of course, this is clearly not enough procrastination; this only took a couple of days. After completing this project, I just didn't feel enough pressure to work on the presentation. So the next thing I had to do was I wanted to make a virtual conference inside of Animal Crossing.
00:27:01.080
We saw the clip earlier today, but that clip actually cost me a lot of time. I had to grind a lot on Bells so that I could buy all the stuff to lay out and display for everybody. But then, of course, I needed a way to record the video that came off of my Switch so that I can give the presentation in Animal Crossing.
00:27:41.600
So I learned about that and bought a video capture card so that I could record all the data from the Switch, and I had to figure out the right software to use to record it, which was extremely hard as well. Now I also needed to get a tripod for the camera, but it was very difficult to get a tripod because it was very COVID outside.
00:28:12.630
But the good news is that now that I’ve done all this yak shaving, I'm ready to become a Twitch gaming streamer! This has all prepared me for my next big career, which is to launch myself into the great world of online game streaming. So when I decide to retire from programming, I can just play Animal Crossing online all day.
00:28:50.849
The next project that I did, though, is I still didn't feel enough pressure even though I decided to start a new career in streaming games. I decided to do something which I call the Aaron Project. After hacking my camera, grinding for Bells, dealing with capture cards, tripods, and starting my new career as an online streamer, I decided to design and build a sign to let me know every time I had messed up.
00:29:20.870
This is where I came up with the Ay-Ay-Ron sign. Essentially, I built a sign that sits in my office above my desk. This is the sign! Then I designed a PCB; this PCB controls the sign and the PCB has a serial UART connection, so I can hook this PCB straight into my computer and have my computer control the sign.
00:29:45.260
Now, I've wired it up so that every time I execute a command in my terminal, if it fails or if any of my tests fail, the sign will display a warning. Right here is the serial port on the PCB that I use to control it, and this sign will let me know anytime I’ve messed up.
00:30:09.530
Moving on, our main story tonight concerns where clauses in your Active Record queries. When you need to offload complexity to the database, they're there for you. We're going to talk about how where clauses work in Active Record, some features that you might not know about, and then we're going to talk about profiling and speeding up where clauses.
00:30:56.100
Now, when I say profiling, I don’t mean profiling your application; I mean profiling Rails itself. Certainly, these same profiling techniques can be used to profile your application, but today, we're going to look at how to speed up Rails itself. Now, this story started a while back. We have an internal blog at work, and somebody posted on the internal blog like, "Hey, check out this life hack: if you manually sanitize IDs yourself, it's much faster than letting Active Record sanitize the IDs for you.
00:31:47.060
So if you have a large list of IDs and you need to do an IN statement, doing the manual sanitization is way faster than asking the WHERE clause to do it. I read this, and at first, I just couldn't believe it! The next thing I thought is, 'Well, if it's true, why would that be?' These two things do approximately the same thing, so why would you want to use the harder version when you can just use the easy version?
00:32:11.370
In order to figure out what was going on, the first thing I did was write a very simple benchmark. Now, this benchmark just compares the two different strategies using this great benchmarking gem called IPS. I really like this gem because all it does is run the same code over and over again for five seconds, and whichever chunk of code can run more times in those five seconds is the faster version. This is nice because I don’t have to think about how many times I should run this; it just does it for me!
00:33:44.839
Now, what this means is the more times you run, the faster your code is. So we want to have a higher number of iterations per second—our faster code will have higher iterations per second. Now, if we look at the results for this benchmark, they are incredibly surprising! Actually, sanitizing the IDs yourself was about 74% faster than calling the easier API, and this really perplexed me! Why would this be the case? These two things were doing almost exactly the same thing! So how can the performance be so dramatically different?
00:34:36.360
Now, before we dig into this issue, I want to talk about using WHERE with Active Record. So we’re going to get a little bit back to basics here. Let's take a look at calling the WHERE method and what it actually does and the SQL queries it generates. With Active Record, the WHERE method is simply used to manipulate the WHERE clause that's generated in your SQL statements. We use this method anytime we want to add constraints to the query we’re making, and these calls are additive.
00:35:33.790
So if we call WHERE multiple times, it will add multiple things to your WHERE clause! We can keep chaining WHEREs and saying we want to add this and this and this and this. So from a high-level perspective, we're translating Ruby calls into SQL. We're essentially taking the Ruby language and converting it into the SQL language, and there must be some process for converting Ruby code into SQL and executing it.
00:36:49.680
If we look at our benchmark again, we'll see that the faster version is doing some of that translation to SQL manually. So we can kind of tell intuitively that the speed difference must come from the way that the slower example does SQL generation. So, something about the automatic SQL generation is slower than doing it manually. Another interesting thing is that if we look at this particular example in the console, this isn't actually the SQL that gets generated! We see the SQL like we think it should be generated, but when we look at the console, that's not the SQL that's actually generated.
00:37:39.290
What’s actually generated is— you’ll see the same SQL statements, but they’ll have a LIMIT 11 attached to them, and this is because Active Record is lazy about generating the query! In fact, the inspect method on Active Record will add this LIMIT 11 to the query before it’s executed. So, if we want our WHERE statement to generate the SQL that we would expect, we need to proactively load them.
00:38:26.830
Now if we look at these three calls, we will notice a difference between the behavior. With the first one, when we eagerly load, no limit is added. If we call just .all without inspecting it, nothing gets executed, and nothing's executed because we didn't access any of the records and we didn't do anything with it, so nothing is executed.
00:39:10.320
Now the third one adds a LIMIT 11, and that's because we called the inspect method on it. Remember that the console will call inspect for us or calling P will automatically call inspect. Now the important thing to learn from this is we actually wrote our benchmark incorrectly. If we look at our benchmark, we’ll see that we’re just calling WHERE, and we’re not actually loading any records.
00:39:51.380
So neither of these things will actually query the database! So the only thing we've proven is that we’re able to do nothing faster when we call sanitize SQL than if we were just calling WHERE, so let’s fix the benchmark! Here we fixed the benchmark to generate a thousand IDs and then try to query for those thousand IDs, actually hitting the database.
00:40:37.170
If we compare that again, if we rerun this benchmark, we'll see that, in fact, before we fixed the benchmark, it stated that the WHERE statement was about 70% faster, and now that we've fixed the benchmark, we can see that well, it’s only 60% faster now. So we’ve sped up our program, but rather than being 70% faster, it’s now only 60% faster! I guess that’s better, but ideally, these two things should be identical.
00:41:23.890
So let’s profile! Let’s actually profile this code and try and figure out what’s going on for these two pieces of code. These two pieces of code are doing most of the same thing. Being 60% slower, it’s too slow! It’s in the threshold of something that I would consider to be a bug! So let’s try to figure out what the bottleneck in this code is, and to figure that out, I like to use a tool called StackProf for profiling.
00:42:10.920
Now this is an example usage of StackProf, so this is using StackProf to profile these two benchmark pieces of code. It looks very similar to the IPS code we saw earlier, only this time we’re just generating profiling information. Now what we’re doing here is we’re generating actually two profiles: one is with our slow case and one is with our fast case.
00:42:49.270
I’d like to generate two profiles because I want to compare them, and it can be helpful to compare the two. If we run this, we’ll end up with two profile files—one for the fast case and one for the slow case. If we run StackProf against the WHERE profile—the slow case—and we look at the top six stack frames, we’ll see that approximately 14% of our time is being spent clearing the database! Now acquiring the database, like normally this might be our target for optimization.
00:43:38.340
So if we were just profiling on a web app, say for example, maybe we see that we’re spending 14% of our time in one particular method. Well, we would probably want to target that method. Now let’s take a look at the profile with manual sanitation or fast case. These top stack frames for the fast case look almost identical to the frames we saw in the slow case.
00:44:25.470
Now this means that if we were to go in and speed up that query method, we would actually be speeding up both cases! And that’s not what we want; we want to figure out why one case is faster than the other and can we get those two bits of code to be the same speed. So speeding up the query method in this case won't actually help!
00:45:16.650
Now, we can figure out, as we see these profiles—they’re not really helping us so much because we don’t know what the difference is. Looking at the two, they’re essentially the same! So why is one faster than the other? We haven’t been able to answer that question. Now these profiles, when we’re reading them, they’re telling us how much time we’re spending in any one particular function call.
00:46:01.510
We call this self; so this is this—that one call, we’re saying how much time do we spend in ourselves versus ourselves and other functions that we call. Well, StackProf also measures the amount of time that one particular function takes plus all of its children as well! So we call that self plus children.
00:46:48.390
So far, we’ve looked at the amount of time or what the slowest functions are, but that only tells us how much time a particular function takes; it doesn’t tell us how much time that function takes plus all the functions it calls. Now, where this is important is let’s take a look at an example.
00:47:27.839
So in this particular case, if we profiled this code, the profiler would tell us, oh, the method—the slow method—it’s the slowest and you should speed that up! It’s true that method is the slowest and this slow caller method wouldn’t even show up on profiles because we don’t spend any time in that method!
00:48:25.280
So the profiler would say, 'Hey, you need to speed up the slow method.' It’s a method named slow. Now, it would be even better though if we could eliminate the slow caller method! Maybe, maybe we don’t need to call slow caller so much. Maybe we can just eliminate that method altogether!
00:49:18.900
But we can’t see the slow caller method in our profiler outputs. So what we need to do is say, StackProf, I want you to sort by the total amount of time that is spent inside of a function. So we say, 'Hey, sort by total!' We can say StackProf, pass in the sort total flag, and this will sort functions by how much time is spent in that function plus any functions it calls.
00:50:15.720
If we sort by that, we’ll get a profile for our slow case that looks something like this, and this is actually much more interesting than the previous profile we looked at. The reason is if we look through it, we can see where we’re spending all of our time! Well, actually, we’re spending approximately 28% or 29% inside of this compile method inside of the two SQL visitors.
00:51:06.370
This is actually very interesting! Why are we spending 30% of our time compiling SQL? Now if we compare this profile to the self sanitization profile, the eral to SQL visitor doesn’t even show up at all! So here we found our difference between the two! In our slow case, we're spending nearly 30% of our time in this compiler, where in our fast case, we don’t even see that compiler in the profile output.
00:52:01.060
So it's not that we're not spending time in the compiler in the fast case; it's just that we don’t spend much time in the compiler in the fast case! We can tell from comparing these two profiles that our actual target is this two SQL visitor or this two SQL compile. We need to figure out why is this method taking up so much of our time!
00:52:51.689
But maybe we can speed up that method! But I think it's better to step back a little bit and say, you know what? What exactly is this method doing? So let’s take a look at some Active Record design to understand what that compile method is doing. I want to look at a little bit of Active Record design; specifically, I want to look at SQL generation.
00:53:45.750
SQL generation in Active Record compile involves a few steps. Our first step is generating relation objects. Every time we call any type of query builder method in Active Record, we’re generating or creating a new relation object. So each time we call, like say, WHERE or ORDER or JOIN or any of these types of query builder methods, we’re creating a new relation object, and that relation object contains information about constraints or things that we want to add to the SQL statement.
00:54:31.639
So in this case, we’re saying, 'Hey! We want to find cats that are age 10 with names Glorian, and we want you to order them by ID!' Each of these relation objects stores that particular information. The nice thing about this design is that we can reuse these relation objects.
00:55:17.609
So we can say, okay, I want you to find all cats that are age 10, and I want you to order them by ID, and then we can actually split and say, well in this case, I want you to order; I want you to find cats named Gorby, and in this case, I want you to find cats named SeaTac.
00:56:12.830
But we're able to reuse part of the query between both of those two. Now this gives us a nice ability to reuse relations and refactor our designs. So the next step is actually Active Record takes these relations objects and converts them into an AST (Abstract Syntax Tree). This AST is simply a tree data structure that represents the SQL query that we want to execute.
00:57:17.450
If we were to imagine the object relationship of this AST, it would look something like this: this is what the data structure might actually look like. It's a tree of objects. So say we have a statement object; it points at a fields object, and the field object points at a list of fields it wants to query on. This tree structure represents the actual string below it.
00:58:13.970
Now, Active Record will go through, look at each of those relation objects, and convert them into an AST that represents the SQL statement that we’re going to execute. So maybe the tree will look something like this. Now we can actually view these or get access to this AST by calling some extremely internal APIs.
00:59:13.260
Now, these APIs are very internal, and they may break at some point in the future, but they are very handy when you're trying to debug stuff, especially this kind of performance issue. If we call dot arrow AST on the relation, we can actually get access to that AST object. So calling this will give us the top of that tree, and we can traverse through the tree and check out the actual tree that represents our SQL statement.
01:00:14.899
Or we can call .dot and this prints out our tree in Graphviz DOT format. Now, Graphviz DOT format looks like this. This is the DOT output; it’s actually a bit longer, so it depends on the relation that you've created in the SQL statement that you're trying to execute. Now this isn’t very helpful, but if we take this DOT format and run it through the dot command line tool, we can generate a PNG file that shows us the actual structure of the SQL statement.
01:01:08.000
So, in this case, we're querying for cats. The output of Graphviz will look like this. So this is the actual structure of the SQL statement that we’re going to be executing. If we zoom in, we can see the column names, so we have name and age, and we can also see the table that we’re executing against as well as the columns and order information that we want to query against.
01:02:11.840
Now, our final step before sending the query to the database is actually generating that SQL statement string, and to do that, we’re just taking this AST, this tree data structure, and we're going to walk the tree and convert the tree into a literal string that we’ll send to the database.
01:03:09.336
So we have a bit of code that’s called a visitor. It's using what is called the Visitor Pattern. The SQL visitor will walk through every one of these nodes in the tree, converting each node into string or each node into a bit of a SQL statement and concatenate all of them together, and then we send that string to the database. This is the—so this particular visitor here is generating a SQL statement.
01:04:10.240
What we saw in the previous slide was actually a Graphviz visitor that walks the tree and outputs the tree to a DOT file that we can use with Graphviz. Now this is very interesting because when we were looking at our profiles earlier, our target is the SQL visitor, the two SQL visitor! It is exactly that—it is that code that's walking through this tree.
01:05:07.270
Now, we know from our profiles that this is the bottleneck, and that’s the thing that we need to figure out why it’s taking so long! So we know that the difference in performance is something to do with the difference in the ASTs that are being generated. So let’s compare the AST for each of these queries.
01:06:04.020
We’ll generate DOT files for our case that uses sanitize SQL—our fast case—and we’ll generate a DOT file for our case that doesn’t use sanitize SQL and we’ll compare the two. This here is the output for the AST where this is the AST that is the fast case—this is where we use sanitize SQL.
01:06:59.890
Now, let’s compare that to the AST for our slow case, where we’re not using sanitize SQL. This is what it looks like. We can see here that this auto-sanitized version is actually much different than our sanitized SQL version! If we add more IDs to the auto-sanitized version, then this array will keep growing and growing in size.
01:07:49.160
We know that we will have more and more nodes to process as we're walking this tree and converting it into an AST, and this actually coincides or works well with the performance that we're seeing. If we compare the performance between the self-sanitization or the manual sanitization and the auto-sanitization, we can see that our auto-san, our auto-sanitization is spending about 29% of our time generating a SQL statement.
01:08:38.480
Whereas our self-sanitization is only spending 0.6% of our time! So we can see that there’s a huge difference between these two, but we can also see that there’s a huge difference between the ASTs. So these numbers correlate; it makes sense! We have a large AST, it takes a large time, and oh, we have a large AST, and it takes a long amount of time to generate that query.
01:09:35.120
So how can we fix this? Well, we have a few options. We could speed up the compiler; that’s one option. But again, this would actually speed up both the fast and the slow cases! So our fast case would get faster; our slow case would get faster too, but that’s not what we want! We actually want to have our slow case be the same speed as our fast case!
01:10:25.930
So maybe instead we could do less work. Our faster example is doing much less work, so maybe there’s a way that we could take this WHERE call and have it just call sanitized SQL rather than going through the entire compiler. If we trace through the profiling frames, we could actually find the point where these relations are being converted into IDs or into an AST.
01:11:16.610
And this is the code that converts those relations into a list of IDs in the AST. We can see here that essentially what we’re doing is we’re creating an IN node, and this IN node points at all the IDs that we’re going to be using in the AST. It would be nice if instead of generating so many nodes, we could just generate a sanitized SQL part right here.
01:12:15.690
Just call sanitized SQL, and we wouldn't generate all those nodes! Of course, it'll require a little bit of refactoring to get it to work, but I have to say that when I encounter some code that I need to refactor, I always ask myself the same three questions: can I refactor this code? Should I refactor this code? Do I want my name on the blame?
01:13:11.920
If I answer yes to all three of these questions, then I'll refactor this code; otherwise, I need a different strategy. Eileen and I worked on optimizing this code for about three months, and it seems like it should be a fairly straightforward optimization, but unfortunately, it wasn’t!
01:14:06.370
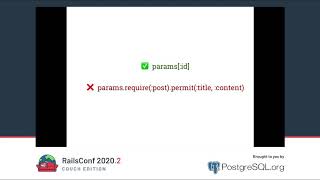
And that’s because there are some subtle differences between the ways of the two code examples. The first issue is that we can’t use the parameters hash and controllers in the same way with manual sanitization as we would with auto-sanitization!
01:15:01.210
So for example, here we have params that may have come in from the controller, and we pass those parameters into Active Record. Now if we look at the queries that are generated by these two statements, we can see that they’re totally different! The first one casts it to an ID, whereas the second one—we use it as a string and generates an IN clause with the string.
01:15:55.580
So this is because the AST has some context about the values that are being put into the SQL statement. It knows, oh, we’re going to be generating WHERE; we’re dealing with IDs here. IDs are integer types, so we need to cast this value to an integer type, and it does that for us automatically.
01:16:53.440
Whereas the sanitized SQL version doesn’t have that context. Another example is URL slugs. Say we have some type of text that comes after the ID that comes in from the controller. Now when this ID comes in, what will the query look like?
01:17:42.340
If we look at the SQL statements, we’ll see using auto-sanitization, it does the right thing; it queries with the value of 100 for the ID. Whereas the manual sanitization will not do that; it generates an IN clause with that string literal. Now again, this is because the auto-sanitization has that context! It knows that we need to convert these into IDs.
01:18:37.200
Now the third issue is very large numbers. So in this case, we have a very large number, and we’re trying to do a query against the database with it. If we look at the SQL statement that’s generated here, we’ll see that the first one doesn’t do any query! It does nothing! Whereas the second one does a very large IN statement with a very large number! This could raise an exception or something.
01:19:47.680
The reason that the first one doesn’t do any query is because it knows, well, this number is outside of the bounds that this particular value can handle, so I won’t do any query. I’ll return an empty set! So to deal with this or try to speed this thing up, the solution that we decided to come up with was to introduce a new type of node called a precompiled node.
01:20:46.390
Part of the reason the compiler is slower than we’d like is because it’s designed to deal with any type of node in the tree, but when application code is calling the WHERE function, we know that at that point, we’re being called with a list of IDs, and we can do something a little bit more intelligent!
01:21:48.160
So the compiler is much more general! It knows about general issues, whereas at that point, when we call WHERE at that call site, we know that we're only dealing with a list of IDs! So what we could do is at the point where we create that list, rather than creating that list of IDs, we can create a precompiled node that has the SQL statement we need to insert!
01:22:52.030
So normally, our tree will contain an IN node that points to a bunch of IDs, and we know that walking through those IDs is our bottleneck! So what we aim to do is instead introduce a type of precompiled node. This precompiled node will point at the old IN statement, but it will also point at the generated SQL that we can use when we're compiling our SQL statement.
01:23:57.000
Now, the reason we point at both of these is so that we can maintain backwards compatibility! For example, maybe we need to change the IN statement into a NOT IN statement, so we need to do some kind of transformation on the tree. Well, we are able to maintain backwards compatibility and get higher performance. So normally, during the compilation phase, we would normally visit these IN statements or all the nodes inside of the tree!
01:24:56.160
Whereas now, when we encounter a precompiled node, instead of visiting all those, we can just say, 'Okay, I want to use this precompiled statement.' So Eileen and I implemented this, and I want to share some of the benchmark results with you. So if we look at the performance difference—this benchmark just measures how fast can we execute a WHERE statement and we're comparing the branch to master!
01:25:46.500
We’ll see that our branch is actually 30% faster! So we’ve been able to improve performance on master! Thirty to thirty percent! Now, we need to compare this with the original benchmark against self-sanitization to see where we are with regards to self-sanitization.
01:26:43.180
So we compare that as well using a thousand IDs, and if we run the benchmarks, we’ll see here, it’s still actually slower! It’s 18% slower than doing self-sanitization! Now I think this is good news because it used to be sixty percent slower! Of course, we saw earlier that these two functions are doing something a little bit different.
01:27:32.490
So we’re not exactly comparing apples to apples; it could be the reason for this performance degradation. But actually, I think that we still have a lot of work to do! This is a work in progress, and I think that we can actually get those numbers closer such that there is no performance difference at all! But for the time being, I think this is a great improvement.
01:28:30.180
Now I’d like to show you all of the source code for this—the entire diff or fixing this particular issue. But I think that would be going from zero to draw an owl! When actually, I want to communicate to you things that would be more useful to you in your daily lives, like the architecture of Active Record or benchmarking and profiling techniques.
01:29:28.800
Those are the things that I actually want to communicate to you in this talk, versus this one particular performance fix! Now I'd be remiss if I didn’t show you some of the actual patch. So let’s take a look at it! This is the bit of code that handles AST conversion, where we're generating IN nodes, and we went from this to either compilation to this.
01:30:19.520
Now the first thing you’ll notice about this code is it’s more complicated—that is true—but you can see under the hood that we're actually just calling this sanitized SQL array, just like our fast example was doing. Now actually, this isn’t merged into master yet, and the reason is we have the main issue with this particular patch.
01:31:14.210
We have this neat function here called serialized too! Now we need to figure out a better name for this method! In fact, what we had to do to get this performance boost is if you look at the internals of Active Record, you’ll see that each type has a serialized method! Now that serialized method actually has—it doesn’t just serialize, unfortunately—it has two responsibilities: it does verification and serialization!
01:32:20.000
So it checks to see if the value is within bounds and then it does a serialization. Well, in this patch, we needed to be able to split up that functionality, so we needed to be able to do those checks, say, 'Are these things in bounds?' and then do the serialization.
01:33:09.490
Unfortunately, serialize is a public method, so we can’t change the behavior of that method. So we just, for the time being, introduced a method called serialize to! So we need to figure out a better name for that.
01:34:06.490
But once we do, we’ll merge this in or we’ll just make this private or something like that! We’ll figure out something, but for now, we have this fun method name!
01:34:38.170
All right, let’s wrap this up! The first thing I want to say is that not all code is equal! We saw those two bits of code at the very beginning, and we saw that they did the same thing, but in fact, they’re not equal at all! They handle different cases, and this manual sanitization route may not be applicable in the same cases as these regular Active Record calls.
01:35:32.409
So it's kind of dangerous to say, okay, these two things are the same! They are probably not exactly the same! However, similar behaviors should have similar performance! But these weren’t even the same; the performance was very different! The performance should be very close. If they do approximately the same thing, the performance should be approximately the same, but in this case, they weren’t even close at all—it was very different!
01:36:24.290
So I would consider this poor performance to be a bug! If you encounter something like this with Rails, you should absolutely report it as an issue rather than saying it’s just a performance pro tip. It’s cool to have performance pro tips like that, but really, we shouldn’t be working to make the framework faster.
01:37:37.160
I mean, if you really think about it, poor performance in this economy—we can’t afford that! And you’re right, we can’t afford that! We need to be fixing these things! So to recap, today we looked at really great ways to procrastinate! I verified them, it’s really great! We looked at tools for performance, Active Record internals and design!
01:38:27.790
And I hope that you all enjoyed my very first opening keynote at RailsConf! Thank you so much! I really hope that we can actually see each other in person next year! Thank you again!