00:00:11.120
Hello, and thank you for listening to this talk. I'm Koichi Sasada from Cookpad.
00:00:15.120
This year, I created a brand new debugger called 'ruby/debug.' I want to introduce this term in this talk.
00:00:30.080
The debugger has already been released and can be used with Ruby 3.6 or later. It will be shipped with Ruby 3.1, which will be released in December this year.
00:00:34.239
The Ruby 3.1 development branch has already matched the bulk of gameplay, so you can try Ruby 3.1 along with this new debugger. This debugger has many novel features that were not previously available in the Ruby world, and I hope you will enjoy these new features.
00:00:52.079
This talk will demonstrate the basic usage and advanced features of this new debugger. The presentation slides along with this talk's script are available at this URL. Please enjoy!
00:01:28.560
Let's introduce myself before the presentation. I'm Koichi Sasada, and I am an interpreter developer.
00:01:31.840
Usually, I develop Ruby internals such as the virtual machine and garbage collector. Last year, I worked on the language implementation for Ruby 3.0. This year, I've mainly spent my time creating this new debugger.
00:01:43.920
Before I introduce the new debugger, I want to summarize what a debugger is. The main purpose of a debugger is to help debug your applications. When we encounter a bug, we need to investigate the causal programs. First, we check the backtrace to determine where the issue originates.
00:02:03.920
Usually, we also use print statements to display the program state, using 'p' or 'pp' methods in Ruby. Sometimes we might use 'binding.pry' or 'binding.irb' methods to enter the interactive Ruby console on a specific binding.
00:02:59.519
Another purpose of using the debugger is to better understand the program. Learning about the program is one of the best ways to understand its internals, and in such cases, the debugger provides useful features.
00:03:05.200
It allows users to control the execution, for example, by specifying breakpoints at which they want the execution to stop and stepping forward line by line.
00:03:22.560
In the Ruby world, we already have several debuggers. 'byebug' is the most popular debugger for Ruby in recent days.
00:03:30.560
The previous debuggers, like 'debug.rb' from standard library available since Ruby 1.0, are not well-maintained, and maybe nobody uses them. However, I decided to create this new debugger for several reasons.
00:03:50.239
One reason is the performance of existing debuggers. When we use breakpoints, existing debuggers can slow down the program significantly. Recently introduced TracePoint features help to mitigate this slowdown, allowing us to improve the performance of debugging.
00:04:14.560
I want to ensure that developers do not hesitate to use the debugger during development. Additionally, I want to provide IDE integration by default, as the usual debugger console can sometimes be challenging to use.
00:04:51.680
For instance, we need to use commands in the console to set breakpoints, but I would prefer a more intuitive approach, such as clicking on the source code in the editor to specify breakpoints.
00:05:16.960
Another issue we face is that printing nested data structures can result in a huge output, which can be overwhelming. I would like to have a feature to expand the output by clicking, much like in JavaScript consoles.
00:05:40.480
Another reason for creating this debugger is that Ruby 3.0 introduces a new Ractor mechanism that isolates object spaces, while existing debuggers do not support it. Although the current debugger does not support Ractors yet, it is one of my motivations.
00:06:02.720
Lastly, my biggest motivation for creating this type of tool is that I enjoy building them. Although it's technically challenging, it’s highly rewarding.
00:06:23.760
Now, let's introduce debugging. This talk will not explain how to use the new debugger but will focus on the types of features it provides.
00:06:43.360
For detailed usage, please refer to the documentation on GitHub. The README contains everything you need to know, along with around a thousand lines of content.
00:07:02.319
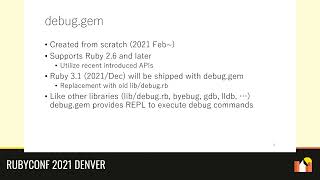
Debugging has been created from scratch this year. The gem has already been released, so you can install it using the 'gem install debug' command. It supports Ruby 2.6 and later as it utilizes newly introduced APIs.
00:07:59.040
Ruby 3.1, which will be released soon, will ship with this debugger to replace the old 'debug.rb.'
Similar to other debuggers, such as byebug or gdb, it provides a library that accepts debug commands for real-time bug investigation.
00:08:43.200
To use the debugger, there are mainly three methods. The first is using the 'rdbg' command, similar to 'byebug' or 'gdb' commands, where you specify the Ruby script or external commands with the '-g' option.
00:09:06.080
The second method involves rewriting your application to require the debug library. This approach is popular with developers.
00:09:31.120
The third method is to use an IDE, such as Visual Studio Code, where you need to set up the launch.json file in your workspace. Thankfully, the Ruby 'rdbg' extension generates a default setting, so you don’t need to delve into the details.
00:09:54.399
After setup, you just need to click the 'Start Debugging' button to start using the debugger.
00:10:18.720
Let's take a look at a basic demonstration of the 'rdbg' command. By invoking the 'rdbg' command with the target script, it invokes the Ruby interpreter in debug mode.
00:10:54.080
The debugger pauses at the beginning of the script, allowing you to see where it stops. You can use the 'step' command to move to the next line and continue stepping through the code.
00:11:33.040
Using an empty command simply repeats the prior command, so we can step repeatedly. Additionally, you can inspect local variables at any halted point in the execution.
00:12:08.240
You can step into methods and observe the backtrace along with the parameters provided. When the method returns, you will see its return value.
00:12:38.080
You can also continue the program’s execution by using the 'continue' command.
00:12:57.200
This demonstration also shows debugging with VS Code integration. You can start debugging from the menu and specify what kind of program you want to run. If there are no breakpoints, the program terminates immediately.
00:13:45.600
To specify a breakpoint, you can press the F9 key on VS Code and retest the debugger. You should see the program halts at the breakpoint.
00:14:10.080
As you can observe, local variables are displayed, and you can expand nested data structures by clicking on them.
00:14:36.400
Execution control is also manageable through buttons on the card, providing an intuitive debugging experience.
00:15:01.760
The debugging provides basic features similar to other debuggers, including specifying breakpoints.
00:15:34.560
Three methods can be used to specify breakpoints: one is to use the 'break' command in the debugger console. You can specify files, lines, method names, and raise exceptions.
00:16:06.720
You can also specify conditions under which the execution should break.
00:16:30.400
Another way is to write 'binding.break' in your application, similar to 'binding.pry' or 'binding.irb'. This method is straightforward if you can modify the source code before executing the program.
00:17:02.240
The final way is using IDE breakpoint features. Currently, we only support VS Code, but we plan to extend support to more platforms.
00:17:15.520
Utilizing the break command or IDE support allows for breakpoint specification without modifying the source code. I believe this is the easiest way to use debugging.
00:17:45.680
The 'binding.break' method in your application is a well-known style, allowing you to control breakpoints from your application code.
00:18:10.080
Another interesting idea for using the 'binding.break' method is in conjunction with the 'do' keyword. If the 'do' keyword is present, it doesn’t stop execution but executes the debug command.
00:18:45.520
This provides trace information specifically for the method execution, helping you focus on the debugging process.
00:19:01.760
In general, a developer's target program cannot communicate with the underlying debugger, but this feature enables that interaction. It allows you to utilize the debugger's features within your application.
00:19:34.080
The debugger offers normal execution control features, including stepping, stepping over, and stepping out of code blocks.
00:19:54.080
For example, using the 'step' command allows you to enter a method and then stop at specific lines for detailed analysis.
00:20:32.080
The 'step over' command stops at the next line but does not interrupt method calls, allowing a smooth debugging experience.
00:20:51.680
It stops after returning from the current scope and allows further execution checking.
00:21:00.080
When the program stops at a breakpoint, you can view the backtrace along with the parameters, which helps in debugging.
00:21:23.760
With 'debug.rb', you can only access the specified binding, but with the new debugger, you can access any bindings in the backtrace using the 'with frame' command.
00:22:08.480
Therefore, you can check variables using commands such as 'info' or 'outline.' You can even evaluate Ruby expressions directly in the debug console.
00:22:30.960
I have introduced basic features available in many other debuggers, but now I want to show advanced features offered by the new debugger.
00:23:00.560
Today, I'll cover four advanced features.
00:23:06.160
First, the debugger supports remote debugging capabilities. You can open debug ports by using the 'rdbg' command with the 'open' option.
00:23:23.680
After opening the port, you can attach to it using the 'rdbg attach' command, allowing you to control the target program remotely.
00:23:43.760
This feature is crucial when debugging processes that do not have a tty, such as daemon processes or redirect processes with shared pipelines.
00:24:00.960
Should debug ports remain open, you can attach anytime to check the program state, which greatly aids development.
00:24:28.080
Next, I want to show you seamless integration with VS Code and the Chrome browser. If you are already debugging in the debug console but want to switch to VS Code, you can use the 'open vs code' command.
00:24:58.440
Once executed, it waits a few seconds while VS Code launches automatically, and debugging can continue there.
00:25:21.120
Likewise, you can utilize Chrome as a debugger frontend by using the 'open chrome' command. You will receive a URL.
00:25:36.640
Copy this URL into the Chrome browser, and you can continue debugging within Chrome.
00:25:54.560
You have options to select either VS Code or Chrome as a debugging frontend through the 'open' option.
00:26:11.040
Furthermore, if you're not using VS Code to modify source code but still want to utilize it for debugging, this feature will be advantageous to you.
00:26:32.160
Next, we'll explore post-mortem debugging.
00:26:38.080
This allows the debugger to activate when a program raises an exception, such as a 'zerodivisionerror.'
00:26:58.160
You can enter the debug console right when the process terminates due to the exception, allowing inspection of variable states at that moment.
00:27:10.720
This feature helps you investigate issues further.
00:27:25.680
Lastly, I want to demonstrate the recorder and replay debugging functionalities.
00:27:41.440
If you enable this feature, you can record execution information and then step back to previous execution points using the 'step back' command.
00:27:57.080
This is highly beneficial if you want to check the last status before a breakpoint.
00:28:28.080
This feature is currently not optimized, as it consumes time and memory; thus, it isn't feasible to use it for entire execution.
00:28:43.760
Nevertheless, it can be applied to a limited context.
00:29:06.240
You can use this recorder and replay debugging feature with VS Code. Start debugging and utilize the step back button to see previous states.
00:29:25.840
At the start of this presentation, I mentioned that one of the motivations was to enhance debugger performance.
00:29:53.360
The following figure illustrates how performance degrades using other debuggers with numerous breakpoints compared to the ruby/debug.
00:30:02.480
When employing 'byebug,' the slowdown can range significantly, resulting in a thirty times slower performance compared to regular execution.
00:30:29.280
By contrast, with debugging, we observe no performance penalties.
00:30:36.240
Finally, I would like to show acknowledgments. Onosang assisted me in making the test framework for the debugger and for integrating with the Chrome browser.
00:31:04.000
The test framework was achieved through Google Summer of Code this year. Stan Lawson made many contributions by submitting patches to improve debugging.
00:31:23.680
He suggested many valuable ideas from the Rails user perspective. Many others have also assisted me.
00:31:38.720
Thank you so much.
00:31:54.880
In conclusion, ruby/debug is a newly created Ruby debugger developed from scratch. It is fast, has a user-friendly interface, and provides many features.
00:32:14.560
You can use it now by installing this gem. Though it is not yet fully matured, your feedback will be vital for its improvement.
00:32:50.720
If you need any advice or have requests, please feel free to contact us.
00:33:00.000
Thank you for your attention. I hope this debug gem will help your development.


