00:00:14.920
So, let me go ahead and get started. First of all, my name is Aaron Pfeifer. For those of you who don't know me, today I'm going to be talking about application monitoring using two open-source Ruby projects: Sensu and BatsD. There are entire conferences on application monitoring, but today we're going to look at a small slice of that using these two technologies and what we at Tapjoy call 'keeping the lights on.' There's a GitHub repo link at the bottom here that has all the examples from the slides as well as documentation on how to get Sensu and BatsD up and running on your own laptop.
00:00:52.399
There are really two things that I want everyone to take away from this session. The first is that as engineers and organizations, we really need to focus on and spend time and effort monitoring our business and system metrics so that we can operate effectively. You know, we're all here building Rails apps, spending time looking at performance and good design, but we often forget a major part of the process of building new features: how do we monitor it? How do we ensure it's actually working properly when it goes live?
The second takeaway is that there are many open-source technologies available for monitoring, and this field has exploded over the past few years. Ruby has played an important role in that, as has Rails, with principles such as convention over configuration and simplicity guiding us. However, we still have a long way to go. There are many problems we need to tackle and a lot to learn. The truth is, some of us in this room have walked into work over the past year and found that deployed code from the other day broke everything.
00:01:54.720
Why does this happen? We don't deploy code unless we have specs for it, right? Well, that's the ideal scenario at least—we should write specs before going live. But what happens when it does go live? There's nothing testing that, and that’s what monitoring is for. Monitoring is our 24/7 RSpec running live in production against real production data.
This needs to be part of the ideal process because it's going to catch problems we wouldn't have seen otherwise. A little bit about me: I'm based out of Boston and have been working with Ruby for quite a while now on various Ruby and Rails projects. My main project is called State Machine. I'm a principal engineer at Tapjoy and previously worked at Vixmo. Over the years, I've learned that as you grow and scale, you hit issues with downtime, and encountering downtime costs real money—it has a significant effect on your company. If you're running a $10 million business, even hours or days of downtime can cost hundreds of thousands of dollars.
00:02:51.440
But when we talk about downtime, what does that really mean? How can monitoring help improve this metric? What we usually think of as downtime is when our website returns a 500 error or takes too long to respond. But what do you do in a case where everything seems fine? For example, if Amazon returns a 200 response quickly with no CSS or images, people won't be able to buy anything from that site. That has to be considered an outage too.
When we think about this, tools like Pingdom might not catch that. So, what metrics can we monitor to detect this type of downtime? I like to categorize these into three types.
00:03:36.720
The first type is business metrics. While these won’t necessarily tell you the root cause, they are crucial backups that inform you when there's an outage affecting key performance indicators for your business. At its most basic level, this could be revenue, but it can also include conversions, new users, and purchases. We've all encountered situations where we didn’t validate the presence of a boolean field. Such validations may seem innocent, but they can silently fail and prevent new users from being created without any visible exceptions, leaving us unaware unless we are tracking those new user metrics.
The second type includes application performance metrics, which typically come from services like New Relic. These metrics deal with individual requests and how performance is perceived by users. For example, we might look at the response times for our application, and if it’s taking over 100 seconds to return to the user, it's clearly causing major issues and could be directly correlated to conversions.
The third group is system metrics, which help identify the root cause of any infrastructure outage. These can include metrics from Memcached, Redis, and network activity. For instance, let’s say we have a disk usage metric indicating we aren’t rotating our logs as needed; this can lead to serious issues with a server, like a database server. Therefore, monitoring these different types of metrics is essential.
When talking about monitoring tools, Pingdom is useful for worldwide outages, and New Relic is great for application performance metrics. However, we need a tool for accessing and monitoring real-time system and business metrics that works well in the cloud and is ideally written in Ruby—something we can read, understand, and contribute to. This is where Sensu and BatsD shine.
00:07:38.320
Let’s go over what these two technologies are and how they fit into your architecture. First, Sensu is a framework written by Sean Porter at Sonian. It serves as the base for your monitoring infrastructure and is built with cloud-based apps in mind. At its core, its purpose is to run commands on various servers in your infrastructure and process the results. That’s really what it's great at. While many features complement that functionality, that's its primary strength.
BatsD is a time series database that implements the same protocol as StatsD. It tracks real-time metrics, aggregates them, and rolls them up over periods. Unfortunately, BatsD doesn’t have a logo yet, so I took it upon myself to create one. Now, let’s walk through how this architecture fits into your overall setup. We assume that you have a set of production servers you want to monitor—these can be app servers or databases. Once they're running, they connect to the Sensu stack, allowing it to run system-specific checks.
00:09:21.279
Once we have all those checks, we want to track metrics from these checks. If we add Memcached servers, we will track those metrics too. Here is where BatsD comes into play; the metrics returned from the checks go through Sensu and are stored in BatsD. Once we have all the system metrics being stored, the next step is to retrieve our business metrics. Our app servers talk directly to the BatsD server using the same mechanism that we would normally use for system metrics. Finally, once we have access to those business metrics, we can implement checks through Sensu, which read the data from BatsD and alert us based on predefined thresholds for that data. This is how we're using BatsD and Sensu to fill in gaps in our monitoring solutions.
00:10:54.399
Now let’s discuss Sensu’s core components. The primary component here is the server process, which orchestrates the entire system. Its main responsibility is to decide when to publish requests to run checks on your servers and to which servers to send those requests. The 'when' part isn't particularly interesting; it's essentially a cron-style implementation. The 'who' part is more intriguing. We can think of Sensu's operations from the perspective of its message bus.
The message bus allows Sensu to communicate with the various servers in your infrastructure. Sensu uses RabbitMQ for this purpose, and if you haven't used RabbitMQ yet, I highly recommend it; it's an excellent technology that makes Sensu operate effectively. When Sensu fires up for the first time, it doesn’t know which servers are running in your infrastructure—it becomes aware of them only when clients start registering with RabbitMQ, allowing Sensu to monitor them automatically.
00:13:34.720
Let’s consider an example: on the left, we see what looks like server roles, such as Memcached and Redis, which in Sensu's terminology are called 'subscribers.' Each subscriber has a fanout exchange in RabbitMQ, meaning any check request published to that subscriber will be sent to every client consuming from that exchange. We have various bindings that establish this connection. On the right, there are clients in the system—these are our servers. When a Memcached server starts up, it listens to the Memcached role, and any Memcached check published through that exchange will be picked up by any client bound to it.
Now, when a client picks up a request to run a check, we enter the Sensu client process where the client runs the check and returns the results. There are two primary requirements for checks: to provide an exit code indicating the check's severity, whether it is 'OK,' 'warning,' or 'critical,' and to provide output which can include individual metrics or debugging information depending on the check. Once a check is running and returning results back to Sensu, the next question is—what do we do with those results?
00:15:29.440
This is where handlers come in. Handlers are commands that take the output of a check and perform actions, such as sending an email or a PagerDuty alert. You can think of this in a way similar to how piping works in Linux. The JSON output from the checks gets piped to the standard input of your handler command. The Sensu admin interface is where everything starts to come together; it’s an open-source Rails app that allows you to see all the checks that are running, the alerts, and the clients that are connected. All this data is accessed through a RESTful API, so we can modify it and add additional features as needed.
Here’s a diagram showing how all these components come together, illustrating Sensu's simplicity. If you look at the underlying implementation of Sensu, it's straightforward; the core of the product lies in the community-provided checks and handlers which are essential.
00:18:44.080
Now, let's shift our focus to the BatsD architecture, which serves as our time series database. BatsD has two core processes: the receiver process, which aggregates real-time metrics and stores them in different data stores, and the API, which allows you to query the stored data points. BatsD is entirely written in Ruby and sits on top of a VM, making it accessible for anyone to follow the implementation.
BatsD uses three different data stores depending on how real-time the data needs to be stored. Memory retains the last data points, which can be from less than a minute ago. Redis is used for short-term data rollup, typically from minutes to hours or even days. The filesystem stores long-term data for months or even years.
Just as with Sensu, there are three types of metrics reported to BatsD: counters, timers, and gauges. Counters reflect relative changes in a value, like plus one or minus one, and are summed over time. Timers represent absolute values at any specific time, and as time goes on, these are averaged as they roll up. Finally, gauges are less commonly used; they record every data point to disk without aggregation.
00:21:41.760
Configuring BatsD is simple, as shown in its brief configuration example. It operates on a few assumptions about your data, following the convention over configuration philosophy. The key focus is on retentions, determining how long your data remains and at what granularity. For instance, we define two retentions: one keeps around 1,440 data points at one-minute rollups for roughly a day, and another keeps about 8,640 data points at five-minute rollups for about a month. You can adjust these values if you require longer data retention.
Once we have BatsD up and running, we can use the statsd gem, which supports the statsd protocol, making it easy to record counters, timers, and gauges. The next step is integrating this into your application. Before doing this, it’s essential to identify key performance indicators for your business, as this will determine what you want to alert on. Examples include revenue, new users, conversions, and potentially push notifications if you're in mobile.
00:24:16.799
Integrating metrics into your Rails application can be done through Active Record callbacks. For instance, you might track metrics in an after-create callback or within a controller's action. The nice thing about using BatsD is that it typically has a minimal impact on application performance, as metrics are transferred over UDP.
Additionally, Rails 4 allows us to use its notification system to track metrics, similar to New Relic, which gathers information about requests made to the server. We might track HTTP status codes, and in doing so, we’re essentially collecting the same insights that New Relic provides.
00:25:45.919
Now that we have Sensu up and running with BatsD integrated, let's explore the checks. This basic check example consists of just a few lines of code, demonstrating Sensu's intuitive interface for defining checks. Two key components here are command-line arguments that set thresholds for warnings and critical alerts. For example, we might monitor the 15-minute load average on a server.
Next, let’s examine a more complex check for tracking Memcached sets and how we can leverage the Ruby community’s work. By using the Memcached gem, we can quickly access its stats API and output metrics for further action—allowing us to track a wealth of information effectively. Remember, since this is written in Ruby, we can encapsulate specifications around our checks, adding more robustness to our monitoring setup.
00:30:32.400
After writing the checks, we need to configure them within the Sensu server. Sensu uses a JSON configuration format that may require a cheat sheet to remember configuration meanings. For example, we can configure a load average check that commands Sensu to run the 'check-load 15' command on a set of subscribers, such as our databases, every 60 seconds. After ten failures, we would trigger a set of handlers, including a mailer handler, and receive reminders every 3,600 seconds if the check continues to fail.
The configuration for a memcached check would be similar, with an essential difference being the type set as reporting metrics only—no alerts. Thanks to the community, we already have checks for various technologies like Redis, Memcached, and Rescue. Furthermore, if you're transitioning from Nagios, much of this work will be compatible with Nagios plugins.
00:32:28.319
Next, we should delve into business checks. These differ from system checks in that they don't behave as predictably. Ideally, our revenue should trending upwards, simplifying alerts. However, revenue trends can often be more erratic. The ups and downs of revenue can vary by time of year or other factors, making it challenging to interpret trends.
Patterns do exist, and we can start by tracking absolute values to catch significant drops, such as when revenue hits zero over an hour. This basic approach can be the foundation for identifying more complex patterns later. For instance, we can calculate percentage differences from hour to hour or day to day, using trends for better forecasting.
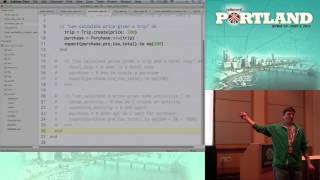
Here's a practical example using the Sensu API to define a check that looks at total revenue over the past hour, alerting if it falls below a certain threshold. Similarly, tracking percentage differences allows us to understand fluctuations better by comparing current revenue with that of the preceding hour.
00:34:57.120
Lastly, we'll discuss our handlers. They define how to act on check results. Here, we see a basic handler example that takes metrics reported to our BatsD instance from our checks. Just like checks, handlers can use the statsd Ruby gem to report metrics in a straightforward manner. The handler processes outputs from checks and reports them to BatsD.
Another handler example is the PagerDuty handler, which lets us process failed checks and send alerts to PagerDuty. This design also allows us to prevent multiple alerts for the same issue, triggering only one incident per failure. The core logic is in the handle method, where we create an incident on PagerDuty showing the check name, client, and output.
With handlers configured, we follow a simple process—defining the type and command within the handler configuration file. The 'pipe' type ensures that all check results are piped into the handler. By leveraging the existing community integrations, we have a robust start to our monitoring solutions.
00:37:50.440
As we wrap up, I want to highlight that everything we've discussed today is actively used by Tapjoy in production, monitoring hundreds of servers and processing thousands of metrics per second. This monitoring plays a crucial role in our development process, ensuring we don't overlook its importance as we develop new features. However, we still face challenges; effective monitoring isn't easy yet.
Traditionally, engineers have not taken responsibility for monitoring, leaving it solely to ops. This needs to change; monitoring must be part of the engineering process, enabling easier definitions of checks directly within our Rails applications alongside code changes.
Moreover, we should automate the tracking of metrics when deploying the infrastructure using tools like Chef and Puppet, incorporating smart defaults and alerts that eliminate excuses for missing critical metrics. Developing these seamless integrations and configurations could be a game changer in monitoring, ensuring that alerting isn’t complicated and poorly defined.