00:00:09.860
Thank you! Hi everyone.
00:00:15.120
I just have a talk here about YJIT. It's just some random things I found interesting during development.
00:00:21.300
I know it's a keynote, but it's really just a greatest hit from my development experience.
00:00:26.580
This is actually my first time giving a talk at a conference, so mostly I’m just going to read from my script. Please bear with me for the next 40 to 50 minutes.
00:00:33.719
I'm going to take you chronologically through YJIT's development history.
00:00:41.879
When we started the project in 2020, we wanted to do something simple to get our feet wet.
00:00:49.070
At the time, I was looking at overhead in the interpreter, and influenced by that, we tried to design something closely related to how the interpreter works.
00:00:55.500
So first, I'll talk a little bit about the interpreter. The interpreter does not run the text of the Ruby code directly; instead, the text is broken down into small instructions.
00:01:02.340
First, the list of instructions encodes some information obtained through parsing the text, which makes it easier to execute than running the text directly.
00:01:09.000
For example, the order of operations is resolved, so we don't need to worry about running the right-hand side of an assignment first.
00:01:15.840
The interpreter can just go from top to bottom in the list of instructions to execute the code.
00:01:21.180
The chunks of machine code in the Ruby executable implement the logic for each kind of instruction.
00:01:27.000
These chunks of machine code are called instruction handlers. Each handler is designed to pass control to the next handler.
00:01:32.460
They update the Ruby program counter to keep track of which part of the program they are running and then they pass control by jumping.
00:01:38.460
You don't need to worry too much about the details here; the main point is that the interpreter runs the Ruby program a bit at a time with these handlers.
00:01:45.420
Handlers can jump to each other. I made some animations to illustrate how the setup runs over time.
00:01:50.720
We are going to simulate 'x = 2 + 2.' In the middle of this animation, I have the machine code for the handlers as they could be laid out in the Ruby executable.
00:01:56.220
On the right, I am going to log the name and address of the instruction each time we run one.
00:02:02.900
We will run address 30 first, because the first instruction calls 'put_object' as you can see in the leftmost column.
00:02:08.640
After executing the 'put_object' handler, we look at the next Ruby instruction and jump to the handler for it.
00:02:15.840
The next Ruby instruction is 'put_object' again, so we jump back to address 30.
00:02:21.780
We run 'put_object,' and now the next instruction is 'plus,' with address 10.
00:02:29.159
We take the jump, run through the handler, and finally we get to the last instruction, which is at address 40.
00:02:37.319
The main thing I’m trying to show here with the simulation is that there are two execution contexts when the interpreter runs Ruby code.
00:02:44.400
Even though the Ruby instructions are completely linear, the machine code may need to jump forwards and backwards during execution.
00:02:51.480
As you can see from the three arrows, the jumps are necessary because there's only one copy of each handler in the Ruby executable.
00:02:58.080
For example, to repeat the same handler, like 'put_object' in this example, we need to jump backwards.
00:03:04.319
Allowing ourselves to generate new machine code at runtime would mean we are limited by what’s in the executable.
00:03:10.620
So the first design we tried revolved around generating code to eliminate the need to jump.
00:03:16.139
The open machine code is basically what the interpreter runs over time, minus the jumps that stitch the handlers together.
00:03:22.680
This layout creates a linear sequence of Ruby instructions leading to linear machine code, achieving a nice smashing effect.
00:03:28.440
I like this design because it’s conceptually simple. The machine code generated is closely related to how the interpreter runs over time.
00:03:34.680
It was also easy to see how the output could be faster due to the similarity to the interpreter; it’s the same code with a few jump instructions removed.
00:03:42.540
Fewer instructions should imply less work, right? Simple and nice.
00:03:48.900
Well, too bad it's not that easy. We did get some speedup on my upcar, but we actually got a slowdown on Rails bench.
00:03:55.440
Since it's our production use case, we want Rails to run well. So what's the difference between the two benchmarks?
00:04:01.680
Of course, it might be obvious that an emulator for a family entertainment console is different from a web app.
00:04:08.280
However, I want to characterize the benchmarks in terms of how the processor runs them.
00:04:14.820
Processors have performance counters that can tell us how the workload uses computational resources.
00:04:22.139
Since there are hundreds of these counters, it’s hard to know which ones to focus on.
00:04:29.520
Luckily, there are existing tools and methodologies to get a concise summary.
00:04:36.060
We can use the Linux performance profiler to compare the two benchmarks at a low level.
00:04:43.440
The profiler output looks like this:
00:04:49.260
Except for the retiring column, it shows different types of bottlenecks.
00:04:55.380
I created some animations to explain what these columns mean.
00:05:01.740
To run some computation, the processor has to know what to execute first.
00:05:09.000
Machine code is stored in memory, so the processor has to load from memory before decoding it.
00:05:15.120
In each clock cycle, the front-end issues a few operations to the back-end for actual computation.
00:05:21.300
In this example instruction stream, we want to do three multiplications but there are only two arithmetic units in the back-end.
00:05:27.660
The back-end can execute two multiplications simultaneously, but while it’s working on them, the third multiplication will be stuck waiting.
00:05:34.680
We call this situation back-end bound since the pipeline is stalled due to the back-end.
00:05:41.520
Congestion can occur at the front-end as well.
00:05:48.900
Loading code from memory takes time, leading to periods when the back-end has underutilized capacity.
00:05:56.520
You can see the ads slowing down in this example, where the back-end has no work to do.
00:06:02.520
After finishing the final multiplication, hopefully, that made sense.
00:06:08.820
This methodology is designed for processes that can perform multiple operations per clock cycle, and percentages are based on execution slots.
00:06:16.380
Let’s say we can execute up to four operations per clock cycle; then we have four slots per cycle.
00:06:23.520
If we spend all the slots computing, we reach the theoretical maximum throughput.
00:06:29.520
As we saw, though, there can be delays in the pipeline; some slots may need to be spent waiting for either the front-end or the back-end.
00:06:37.020
This model counts in slots so it can account for partial delays within the cycle.
00:06:44.280
In the animation I showed, we were still able to perform some computation while waiting for new code to load from memory.
00:06:51.780
So only some slots were spent waiting.
00:06:58.440
Now that we understand what the different columns mean, we can compare the results for Upcar and Rails bench.
00:07:05.160
We can see that Upcar uses execution slots fairly efficiently, with over 60% spent on retiring the computations rather than waiting.
00:07:12.000
In terms of bottlenecks, back-end bound wins, but it’s evenly distributed across different categories.
00:07:19.740
What does Rails bench look like? Well, it's very front-end bound.
00:07:26.520
Rails bench uses a diverse set of Ruby features and a few C extensions, so the processor needs to execute a lot of machine code from different places.
00:07:34.020
This turns out to be quite significant.
00:07:42.900
These results are from running just the interpreter. How does YJIT change things?
00:07:50.880
YJIT generates more machine code on the fly for the processor to load.
00:08:00.200
Even though it's true that YJIT code takes less work to run than the interpreter.
00:08:06.300
Going through this system increases the work for the front-end since jumping to the code generated by YJIT is a new source of delay.
00:08:13.800
If the generated code is much more efficient than the interpreter, it may be worth spending a few slots to access it.
00:08:20.280
However, the initial version simply wasn't optimized well enough.
00:08:26.640
Also, since the design can only handle linear sections of Ruby code, it needs to exit back to the interpreter frequently.
00:08:33.360
Thus, we faced frequent jumps between the interpreter and the generated code.
00:08:40.200
I’ll explain why these jumps can introduce delays.
00:08:46.920
The idea with this profiling methodology is to drill down into each category of delays and identify where in the code these delays occur.
00:08:55.080
I have an example of a contributing factor to front-end bound delays.
00:09:01.680
This occurs when the front end is delayed due to incorrectly predicting where a jump goes.
00:09:08.280
This type of delay happens in the interpreter a lot because of the jumps between the handlers.
00:09:14.640
We must load the address of the jump destination before we can load the instruction at that destination.
00:09:21.240
So running these two instructions has some inherent memory delay, even when things are cached.
00:09:27.600
Modern front ends strive to hide this delay by predicting where these jumps land.
00:09:33.840
By guessing ahead of time, the front end can work while waiting for the actual destination to come from cache or memory.
00:09:40.320
The animation I showed earlier is a bit misleading; while the ads were rolling in, the front end was likely already feeding instructions to the back end.
00:09:47.160
If the front end makes the correct prediction, it appears as though there were no delays at all.
00:09:54.000
However, if we guess incorrectly, there’s a penalty incurred for redirecting the front end and correcting everything.
00:10:00.600
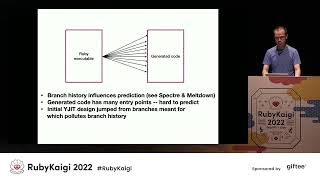
Now, recent security research reveals that front-end predictors utilize previous destinations for jumps to forecast.
00:10:06.960
Unfortunately, there's a growing number of places the Ruby executable needs to jump to as YJIT compiles more Ruby code.
00:10:13.620
The predictor can only track so much history, and we can easily surpass that limit.
00:10:19.620
On Rails bench and Upcar, there’s less Ruby code, so this issue isn’t as severe.
00:10:26.280
There’s also a structural issue with the initial design, where branches are used to jump between handlers that transition to generated code.
00:10:33.540
This means that branches now have history for handling addresses in addition to the growing set of generated code addresses.
00:10:40.800
This doesn’t help the predictor when running the interpreter due to this mixed history, making accurate predictions more difficult.
00:10:47.040
Consequently, we still exit back to the interpreter frequently as a result.
00:10:54.120
That's the longer version of why jumping from the Ruby executable code can be challenging for the front end.
00:11:01.680
At this point, we were two to three months into the project.
00:11:08.640
We knew that jumping between the interpreter and the generated code was taxing.
00:11:16.200
So ideally, we wanted to minimize those jumps.
00:11:22.680
It would also be beneficial if we could further optimize the output.
00:11:30.180
This is when we decided to change our design and started using lazy basic block versioning to address these changes.
00:11:36.960
This is a technique for making just-in-time compilers, which Maxine developed during her PhD.
00:11:44.340
She talked about this in detail during RubyKaigi last year, and if you want to learn more about this topic, please check it out.
00:11:53.160
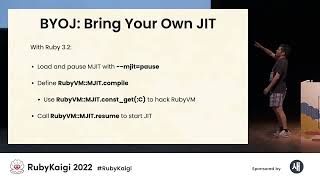
Today, I'm going to focus on the lazy aspect because it's my favorite part; I’m pretty lazy myself!
00:11:59.640
YJIT implements laziness with these code fragments called 'stubs.'
00:12:06.720
Each stub represents some code that hasn’t been compiled yet, kind of like a placeholder for machine code.
00:12:12.060
The general idea is to generate stubs first, then replace them with actual code the first time they’re run.
00:12:18.300
Since the interaction with stubs unfolds over time, I believe it’s easier to understand how they work with some animations.
00:12:25.380
I have an example method here that just calls itself; its name is 'call_self.'
00:12:31.680
Let’s see how YJIT uses stubs to generate code for it.
00:12:39.800
YJIT starts by generating code for accessing the local variable, but when it sees the call to itself, it faces a challenge.
00:12:46.200
It needs to know where the call goes to connect the correct code.
00:12:52.920
In this case, it will go to the method 'founding_custom,' but that won't always be the case for other objects.
00:12:59.520
This is when YJIT decides, 'I don’t want to deal with this problem right now; I'm lazy,' and generates a stub.
00:13:05.020
The compiler completes its operation after making the stub, and now we run the freshly generated code.
00:13:11.960
We did not compile the entire method module; however, running what we just compiled gives us a slight advancement in execution.
00:13:18.240
When we encounter the stub, we are within the body of 'call_self' and 'obj' is 'custom.'
00:13:25.200
From here, we recognize that, at least in this immediate case, the call goes to the method 'founding_custom.'
00:13:32.040
However, we also need to accommodate other cases, so we can solve this using a stub again.
00:13:38.400
We usually check, if a call goes to the stub, whether the receiver is not customs.
00:13:44.760
If that check passes, then we know that the method call goes to 'custom.self,' which simply returns.
00:13:52.680
We can generate the code for that immediately after the check.
00:13:58.920
When we call a method, we have to provide a return address, so the caller knows what code to run once the method execution is complete.
00:14:05.520
We will use the stub for the return address as well.
00:14:12.600
Next, we implement 'custom.self' method.
00:14:18.420
It doesn’t do anything special, so we don’t actually require a stub for that; we can simply generate the code for returning.
00:14:26.280
YJIT then completes generating code during this segment.
00:14:32.880
All the while, we have been generating code for the stub, highlighted in orange here.
00:14:39.240
Once we finish, we can patch the jump from the stub to the new generated code.
00:14:45.480
The new code is directly after the jump to the stub, so we actually need not jump at all; we can remove the jump.
00:14:52.299
When the new code runs, we hit the stub and use the return address.
00:14:58.440
The 'call_self' method simply accomplishes its task and returns.
00:15:05.160
We then adjust the reference to the stub to point to the new code.
00:15:12.300
When we resume execution, we can return from the two method and finally finish running the complete program.
00:15:20.400
Now, let’s examine what happens if you repeat the call with the same 'custom' array.
00:15:29.880
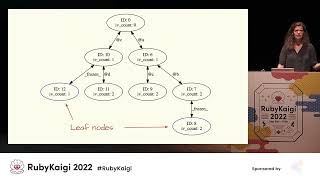
What’s intriguing is that you get this linear layout again, executing from top to bottom.
00:15:35.520
This layout is practically optimal when the execution order is linear, displaying favorable behavior toward the processor front end.
00:15:42.120
There’s a strong likelihood that the next instruction is already decoded since it decodes instructions in blocks.
00:15:48.360
What I find remarkable is that YJIT never performed explicit analysis to achieve this nice layout; we naturally get this from being lazy.
00:15:55.260
This contrasts with how other just-in-time compilers might generate similar code.
00:16:01.920
We don’t record an execution trace nor do we take any profiling data before compiling; we simply create stubs and respond to them.
00:16:08.760
What we are doing here is called speculative optimization in the academic literature.
00:16:15.660
The code performs optimally when the input is the 'custom' array.
00:16:22.200
In the future, though, the method could receive different types of inputs.
00:16:28.560
So, we are essentially guessing what future inputs will occur.
00:16:35.040
If we call the method again with a standard array, which has a '3' in it, we will fail the check and then hit the stub.
00:16:41.640
This will result in generating additional code to handle this new condition.
00:16:48.120
The checks we leave in the code are termed guards, which protect specialized code that follows them.
00:16:54.690
Let’s observe the code produced when this guard fails.
00:17:00.600
This one code path could be linear; if we receive the normal array, we take the first jump.
00:17:06.600
While we keep entering this stub, we gradually roll out and generate more code.
00:17:12.660
It’s common for just-in-time compilers to utilize speculative optimizations, as they are effective.
00:17:18.540
The main approach for achieving speedup is based on making wise guesses using runtime state.
00:17:25.380
YJIT makes predictions about where a method call will go based on its initial behavior.
00:17:32.220
This shares a relationship with inline caching in the interpreter.
00:17:41.160
For a specific code location making a method call, the interpreter remembers the method called.
00:17:47.340
If you repeat the call and it goes to the same method, then it's a cache hit.
00:17:54.000
When you hit the cache, you avoid a full method look-up and save work when setting up parameters.
00:18:00.660
Sadly, this cache only has space for one target, so if it’s called again and goes to another method, it’s a cache miss.
00:18:07.440
Despite this small cache limitation, studies show that it works quite effectively.
00:18:13.680
For instance, using Linux BPF Trace, I was able to measure how often we hit the cache in production.
00:18:20.640
The findings revealed a hit rate exceeding 90%.
00:18:27.360
This refers to the interpreter's monomorphic inline caching.
00:18:34.440
Looking at inline caching on Wikipedia reveals that this type of caching is quite effective in small talk applications.
00:18:39.720
Essentially, method calls generally tend to go to one target.
00:18:46.560
This pattern comes from how people typically write code, which is why I bring up small talk.
00:18:53.520
When writing a method call, you likely have a specific method in mind.
00:18:59.160
Moreover, when reading code, it’s complex to ascertain where a method call goes next if you don’t know.
00:19:05.160
This confusion reinforces why calls pointing to multiple targets are less common.
00:19:12.060
Returning to our example, it shows how method calls can target multiple places.
00:19:18.840
However, the first call target has the shortest path, requiring only two checks to access the second case.
00:19:26.460
The linear layout is still achieved in this case.
00:19:33.000
Thus, speculation based on the first call target works well, as there’s usually only one.
00:19:39.060
With the stubs and laziness, YJIT can generate code for many more Ruby constructs.
00:19:46.560
This is crucial, especially as jumping from the executable to generated code can be very costly.
00:19:54.120
So, once we enter the generated code, we aim to remain there for as long as possible.
00:20:01.500
A key element of this is inhibitor speculation.
00:20:08.160
Not all speculations work out, as we’ve noted, and we can’t generate code for everything at once.
00:20:16.560
Using the interpreter as a fallback lets us build YJIT progressively.
00:20:23.520
More importantly, we can concentrate on the critical Ruby features.
00:20:30.180
Fast forward to today, YJIT clearly speeds up Rails bench, with a timing ratio of about 1.3.
00:20:37.680
We perform the same tasks using fewer instructions.
00:20:44.400
Furthermore, we execute more instructions per clock cycle—enhancing how we use slots.
00:20:51.240
This is reflected in better instruction level parallelism achieved through making good speculations.
00:20:58.140
All of this results in a better layout of code, which we observed earlier.
00:21:05.400
We have managed to overcome the inherent overhead of jumping to the generated code, as YJIT compiles more Ruby features.
00:21:12.480
Thus, we now end up with more machine code than before.
00:21:20.280
However, we still achieve speedup.
00:21:27.600
Having more code than the instruction cache can hold isn’t necessarily problematic—provided we structure the instruction stream to help the processor conceal memory delays.
00:21:34.560
Earlier, I mentioned how the interpreter is integral to YJIT.
00:21:41.700
Let me explain how we utilize the interpreter when required.
00:21:48.480
It's a straightforward two-step process: basically, we undertake two storage operations to memory in the output code.
00:21:56.640
The simplicity of this process reflects how YJIT code functions similarly to the interpreter.
00:22:02.700
Typically, when the output code is more specialized, reconstituting the interpreter state entails more work.
00:22:09.120
For context, let’s delve into why assigning to 'cfp->sp' is sufficient.
00:22:17.040
This represents the stack pointer for temporary values arising during computation.
00:22:24.960
Here, I have a simple method call on 'self,' which breaks down into several instructions.
00:22:31.320
The 'put_self' instruction pushes onto the temporary stack, while the 'send' instruction pops from it.
00:22:37.560
Both 'put_self' and 'send' write to memory in the interpreter and YJIT.
00:22:44.160
If YJIT encounters an unresolved 'send' instruction and has to revert back to the interpreter, 'self' has already been stored in the proper location.
00:22:51.120
So, all YJIT has to do is adjust the pointer so the interpreter can correctly locate the value.
00:22:58.920
This strategy works well when YJIT needs to exit. However, YJIT usually operates independently.
00:23:06.000
Thus, we can find ourselves with code leading to an unfortunate memory round trip.
00:23:12.240
In this scenario, a value stores to memory, and then it retrieves it immediately.
00:23:20.760
This situation may be using the same register, X11.
00:23:27.240
This merges the optimization requirements into the happy path.
00:23:33.480
In cases where enough information is available, we can remove the memory operations and retain values in registers.
00:23:40.680
While making this optimization, we still need to reconstruct interpreter states.
00:23:48.900
Consequently, YJIT positions values in registers, while the interpreter requires them in memory.
00:23:56.520
Thus, we have to store the values back in memory to bridge this gap when we exit from YJIT.
00:24:02.520
I’ve also noted other factors that may require tweaking for implementation.
00:24:09.780
YJIT incorporates multiple moving pieces.
00:24:17.640
Now let’s look at the second part of the optimization process.
00:24:24.840
Recall earlier that the interpreter updates the program counter while running each instruction.
00:24:32.220
It essentially needs to know this to determine what code to run next.
00:24:39.840
When updating through YJIT, everything translates to machine code, so updating the Ruby program counter isn’t mandatory for making process progress.
00:24:46.980
Updates are only required before operations necessitating knowledge of execution progress.
00:24:54.780
Examples include before obtaining a back trace or raising an exception.
00:25:03.960
In addition to the program counter, various other information aids in tracking execution progress.
00:25:10.560
To name a few, there’s the 'I' object, which houses VM instructions and lots of metadata like source code filenames and line numbers.
00:25:17.640
There's also a method object since the same Ruby code could be executed as different methods.
00:25:24.180
Furthermore, a scope object assists with constant resolution and refinement method lookups.
00:25:31.920
Both YJIT and the interpreter need to fill out all of this information during method calls.
00:25:39.060
This is a heavy workload, especially since method calls occur frequently.
00:25:46.560
Conveniently, YJIT often needs this data to run stubs and validate code.
00:25:54.840
Consequently, YJIT effectively possesses a global perspective of where every call leads.
00:26:01.080
If YJIT generates code for a method, we then retain metadata surrounding it.
00:26:09.840
This allows us to speculate that we constantly target methods YJIT already recognizes.
00:26:17.160
When executing a method call, rather than filling out information gradually, we can select from a precomputed bundle.
00:26:24.060
If our bundle covers the correct call graph, we only need to change one variable to select the appropriate progress.
00:26:30.900
This method ultimately requires substantially less work than previously.
00:26:38.220
Incorporating this scheme into YJIT would make it remarkably distinct from the interpreter.
00:26:45.780
However, bridging these metadata-based optimizations would slow down the interpreter.
00:26:52.920
Naturally, making these optimizations necessitates careful deployment to maintain a positive user experience.
00:26:59.640
The caution lies in avoiding sacrificing user interactivity for higher peak performance.
00:27:07.140
So that was kind of the dark side of optimization.
00:27:14.520
I raise this point because I want YJIT to be comprehensive, devoid of notable performance caveats.
00:27:20.760
One area where YJIT excels is its invisibility to users.
00:27:27.180
We compile code with minimal latency that is perceptible to humans.
00:27:34.440
While we desire superior peak performance, we still strive to maintain an interactive feel with IRB.
00:27:41.520
As runtime systems advance and become more complex, there exists a genuine risk of inadvertently trading human interactivity for higher performance.
00:27:48.420
Thus, we must exercise caution.
00:27:58.140
That’s all I have.
00:28:05.520
Thanks for listening, and thank you for having me!