00:00:05.960
Hello, welcome to my talk for RailsConf 2021. My name is Gannon, and this is "Profiling to Make Your Rails App Faster." I'll start with a little bit about myself.
00:00:12.360
I'm a Rails committer and a big fan of the Ruby open source community. I'm currently number 55 on the Rails Contributors Board, and as of this recording, I have made 246 commits on Rails. I have a cat named Waz, who is the reason I’m sitting here to give this talk.
00:00:25.740
In these socially distant times, you may hear him over the course of this presentation. I work for a company called Shopify on the Code Foundations team. One of our main focuses is to improve the developer experience on the Shopify monolith. If you haven't heard of the monolith, it's a really, really big Rails app, probably one of the largest in the world.
00:01:02.520
The origin of this talk dates back to 2019 when I attended RubyKaigi in Japan. It was my first conference, and it was tons of fun to attend. The closing keynote by Jeremy Evans discussed all the optimizations he made to the Sequel and Rhoda gems. To be frank, it blew my mind. I want to pull it for you if you haven't seen it, but it taught me so much about code optimization. After watching, I knew I wanted to learn more.
00:01:43.380
Later that year, I went to RailsConf in Minneapolis and attended a talk by Nate Berkun on the basics of benchmarking and profiling. Another amazing talk! I had previously known about profilers but didn't really understand how they worked; this talk really put things into perspective for me. A few months later, I was finally ready to show the world what I had learned by writing an article on how to write fast code for the Shopify engineering blog, which was submitted to Hacker News and received a lot of reads.
00:02:23.520
The following year, I co-authored a follow-up article on how to fix slow code with Jaylin. Fast-forwarding to February of this year, my co-worker Chris Salzburg started a project to assess how slow the monolith was. He found many areas that needed improvement. 2020 was a big year for Shopify, and a lot of rushed development had taken its toll. Nobody had paid much attention to keeping things fast, and it turns out you can introduce significant speed regressions over the course of a year.
00:03:06.239
After seeing Chris's success in fixing performance problems, I thought to myself, "What about every other Rails app in the world?" I’m sure many of them could use a deep dive on speed optimization. So, I submitted a talk proposal about profiling to RailsConf, and here we are.
00:03:40.680
This talk follows the story of a Rails app, one that was built by a contractor for a small company. Taking a look at the app, we've got views that index and show products, a cart view where we can add and remove products, and finally, we have views to perform checkouts. Pretty simple, right?
00:03:51.180
Just a quick side note: this is a talk about profiling and not about writing style sheets. I'm not very good at making websites look nice, so please pretend it looks professional.
00:04:07.080
One day, the company hires a new developer to start working on the app, and surprise—it’s you. On your first day, your boss tells you there's a problem with the website; it's slow, and you've got to fix it. So, what do you do? After some panic Googling, you come up with some plausible answers. You could add some indexes to your database, which might help speed up queries.
00:04:29.640
Oh, and uh, n plus one queries are bad, aren’t they? We should probably have fewer of those. Maybe you’re putting off upgrading to the next version of Ruby; that wouldn't hurt. Modern web tooling uses a lot of JavaScript, so maybe we could use more of that. The problem is that authors of performance optimizing articles often don’t know what’s wrong with your app.
00:05:06.300
Many of them have recommendations that are generally good, and you should be doing those, but they might not fix your actual problem. This can lead to premature optimization and unnecessary complexity in your app. What we want is a tool to help narrow down performance problems, not recommendations on Rails best practices.
00:05:36.419
Eventually, you come across a suggestion that piques your interest: profiling. That might be helpful, but how can we apply it to our app? If we look at our app's Gemfile, we'll see Rack Mini Profiler. That seems like a good lead. Looking up that gem, we'll find that it's middleware that displays a speed badge on HTML pages. It can do database profiling, call stack profiling, and memory profiling.
00:06:11.820
For those unfamiliar with middleware, it's essentially code that runs on the server before a request is routed to your application code. It runs between you and your app code. For reference, Rails ships with a lot of middleware by default, one of which you’re probably familiar with is the debug exceptions middleware. This middleware bubbles up development stack traces to your browser.
00:06:30.240
It's an exciting time to be learning about Rack Mini Profiler. If you’re on Rails 6.1.3 or later, Rack Mini Profiler is included by default, but if not, you can always add it to your Gemfile. If we boot our app, once the page loads, you'll find the speed badge in the top left-hand corner of the page. It shows how long the page took to load and how many requests were made.
00:07:05.520
Now that we know what Rack Mini Profiler is, let’s talk about its features, starting with database profiling. If we click on the speed badge, we’ll get a breakdown of partials rendered and SQL queries executed. Clicking on SQL queries will expand on the exact queries that were executed, along with stack traces and timings.
00:07:42.840
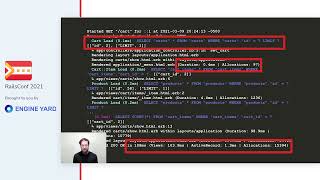
You might find the overall concept familiar; it's essentially the same information that Rails server logs give you. Here's the log for the same request; you’ll notice it lists SQL queries, memory allocation counts, and render timings for views. Speaking of memory allocation, let's talk about Rack Mini Profiler's next feature: memory profiling.
00:08:02.759
This feature requires a gem to work; you’ll need to add Memory Profiler to your Gemfile. With Memory Profiler bundled, we can reboot our app and visit the product index. Using the query parameter PP=profile_memory, we can get a report of how Ruby allocates memory for our request. The report is fairly plain-looking but very detailed. It revolves around two concepts: allocated memory and retained memory.
00:08:51.060
We can see that Ruby allocates 2.8 megabytes of objects while building our view and retains 0.2 megabytes of objects. Memory Profiler can be used on its own to profile arbitrary blocks of code; this is essentially what Rack Mini Profiler is doing for you at the middleware level. Some of you may be wondering about the differences between retained and allocated memory. To put it simply, allocated memory is all the memory your computer takes to perform an operation. This could be responding to a web request, running `bundle install`, or executing a method. Retained memory, on the other hand, is memory that remains allocated after the operation is completed.
00:09:42.780
Let’s look at an example: If we were to profile a simple object creation, we would find that it allocates one object and retains no objects. This is because the object lives within the context of the profiling block and gets cleaned up afterward. If we were to assign the object to a constant, we suddenly have retained memory because constants are global and something that lives beyond the scope of a profiling block.
00:10:10.239
Through this example, we can assume that retained memory is always equal to or less than allocated memory for any operation.
00:10:22.360
Now that we understand memory profiling, let's discuss Rack Mini Profiler's last feature: call stack profiling. Like memory profiling, call stack profiling requires another gem: the Stack Prof gem.
00:10:29.760
So, if we add Stack Prof to our Gemfile and use the query parameter PP=flame_graph, we should get a report detailing the call stacks Ruby ran through to respond to our request. When we do that, we’re greeted by a graph with a lot going on. Before we get into what it all means, we should talk about where the data is coming from.
00:11:00.420
Stack Prof collects call stacks. You're probably most familiar with call stacks from exceptions; when an exception is raised, Ruby prints a stack trace, which is a summary of the call stack that led to the error. These call stacks are gathered by observing running code and taking snapshots at scheduled intervals. We use this data to paint a picture of what your program is doing.
00:11:35.400
An important note to mention is that Stack Prof is a sampling profiler, which means it doesn’t exhaustively snapshot all call stacks for a given operation. The sample rate can be adjusted to show more or less data. As for what Stack Prof measures while taking snapshots, this is where the different profiling modes come in. The three modes are wall, CPU, and object.
00:12:05.280
Wall time is time as you and I know it; you can think of it as a wall clock. Wall time is the default profiling mode that you’ll want to use ninety percent of the time. You’ve probably seen CPU time before in an activity monitor or some task management program; this essentially means the time your computer spends 'thinking' about something. Object mode counts new object allocations, typically, you’ll want to reach for memory profiler when measuring allocations because it's more detailed.
00:12:30.819
Like Memory Profiler, Stack Prof can be used on its own to profile arbitrary blocks of code. We’ll explore this usage a bit more later.
00:12:45.360
Now let’s talk about the graph we saw earlier. They’re called flame graphs. They look like this: Flame graphs are a standard way to view profiling data. On the x-axis, we’ve got wall time, and on the y-axis, we’ve got call stack depth. Below the preview window, there’s a larger interactive view of the graph.
00:13:02.700
Rack Mini Profiler generates flame graphs with Speed Scope. Speed Scope is a profile viewer written in TypeScript that supports a variety of formats from different profilers across various languages. However, there are a few ways you can generate a flame graph. If you’re familiar with Ruby 5, profiles collected with that tool look like this: ArmySpy uses the original Perl script made by Brendan Gregg, the creator of flame graphs, but it’s the same concept, more or less.
00:13:39.539
The call stack depth on the y-axis can also be inverted on some graphs; this is how classic flame graphs look. But the appearance of the flame graph is dependent on the viewer you're using. Flame graphs can take various shapes and sizes. A great feature of Speed Scope is the different ways you can choose to view the data. You can toggle between time order, left heavy, and sandwich modes. Time order is the standard view we’ve already seen: time on the x-axis and stack depth on the y-axis.
00:14:25.220
Left heavy is where things get interesting: time is on the x-axis but no longer in sequence. Similar call stacks are grouped, so you can easily see combined timings for the slowest methods. For example, it’s a little hard to see, but garbage collection occurs multiple times in time order but is grouped into a single entry in left heavy.
00:14:59.639
Sandwich starts with a sortable list of call stack methods. You can sort by self-time and total time—self-time is how much time is spent inside a specific method, whereas total time is the combined time spent in that specific method and any nested method calls. If we click on a method in this view, we can see its position and total time as a flame graph.
00:15:58.680
In this call, we can see Action Controller routing to our controller and rendering a view. While it doesn’t take much time to actually call our controller, the total time for processing end-to-end takes the majority of the profile. Bringing it all together, we can see Rack Mini Profiler has a lot to offer: the speed badges for rendering summaries, memory profiling for object allocation counts, and call stack profiling for call stack analysis. There are even more features you can access with the PP=help query parameter.
00:16:23.279
Now that’s all great, but we haven’t solved anything in our app yet. Now that we know the basics of Rack Mini Profiler and its friends, let’s use them to solve some of our issues.
00:16:41.820
After receiving a report from your boss, stating that customers have been complaining about slow checkouts, you have something to work with. Equipped with your newfound profiling superpowers, you head to work. First off, on the checkout page, we’re going to want to add the flame graph query parameter. We can do this by either injecting it into the view or using the web inspector of our favorite browser.
00:17:00.840
When we submit the form, we can see a flame graph in the preview at the top. We can notice some interesting things: there are several long plateaus in the graph showing we’re spending a lot of time doing just a few things. If we switch the view to left heavy, we can see that there are just two things taking the majority of our time. The first is capturing a checkout payment, and the second is sending a confirmation email.
00:17:38.040
If we assume we're using a payment gateway and a remote mail server, we find ourselves with an interesting problem. Both of these issues stem from talking to remote servers, and often, we can’t control all bottlenecks within our system. The controller that initiates these communications looks like this: when the order is created, we need to confirm it for expensive or time-consuming operations. We can’t optimize these, so we can use Active Job, which allows us to move this logic over to a background job.
00:18:20.019
The Order Confirmation Job encapsulates payment capture and mailing work so we can treat it as a single entity. Jobs can be worked on asynchronously in development or pushed to another worker process in production. Back in our controller, we can replace the previous code with a reference to our new job, telling Rails to do it later in the background.
00:19:06.180
Asynchronous jobs in development work by default, but in production, it’s best practice to use a queuing system. A good choice would be to use a gem like Sidekiq. We can spin up another profile and see our order confirmations are now being pushed to the background. This leaves our controller faster and our users happier.
00:19:41.220
For more information on jobs, the Rails guide on Active Job is helpful. After successfully speeding up checkouts, your boss is impressed. He mentions it would be nice if we could load the products page faster; curious, you decide to investigate.
00:19:53.820
If we break out Rack Mini Profiler again on the products index, we’ll see a lot of spikes. Each spike appears to show product partial rendering. An easy answer to this would be to paginate our records, but sometimes, you’ll encounter a view issue you can’t design your way out of.
00:20:38.420
The view looks like this: we loop through all of our products and render a partial for each one. Here we can use caching to reduce the amount of repetitive work we’re doing. Caching allows us to do the work once and store the result for subsequent use. With this syntax, we can render a collection of product partials and cache them in one line.
00:21:11.520
Now, Rails doesn’t normally use cache stores in development mode, so you’ll need to use the `dev:cache` command to enable it. When you’re done running `dev:cache`, remember to toggle the feature back off. After enabling caching in development mode and profiling again, we can see that our cache hit has driven down our response time from 600 milliseconds to about 40 milliseconds.
00:21:56.540
That’s about a 15x improvement! Even on a small Rails app with simple views, caching can make a huge difference. However, caching is a rather complex topic; I recommend consulting the Rails guide to see all of your options.
00:22:13.140
A few months go by, and you’ve built up your app quite a lot. The production site is working great, and users aren’t complaining. Life is good—until one day, you start to notice that your app is taking a long time to start up, and tests that were once fast are starting to crawl. What could be going on?
00:22:50.220
Well, to better understand the problem, we need to know how development mode is different from production mode. Let’s take a look at the different environments in Rails. This is one level deep in our app directory; this is where our autoload paths live.
00:23:14.960
Each of these subfolders is autoloaded, with the exception of folders that don’t contain Ruby files, so assets, JavaScript, and views are ignored. In development, these paths are searched whenever your application code references an undefined constant. Rails will try to find and load a constant based on the files that it sees in these paths.
00:23:56.280
In production, however, these paths are eager-loaded. This means that your autoload paths are iterated and required on boot, which slows down application startup time in favor of speeding up request time for our users. In test mode, we can assume roughly the same behavior as development mode; Rails will autoload in exactly the same way.
00:24:36.420
This means we want to do as little as possible in development and test mode since we don't know why the app is being booted. It could be to perform a checkout, run a model test, or open the Rails console, for example. In production, the complete opposite is true: we want to do as much work as possible up front to optimize for our users and our infrastructure.
00:25:24.680
Typically, our app will only be booted to handle web requests and perform jobs in production. These two ideals are constantly at odds with each other, making it difficult for developers to account for both while developing features.
00:25:52.920
Like I mentioned earlier, you can use Stack Prof on its own to profile any code. With a little extra work, we can even instrument our profiles to be opened with Speed Scope. Now, this is a little bit of a hack, but this code will profile any code you place between it and open it up in Speed Scope, just like Stack Prof's `run` method, which can be used to profile methods that don’t fit neatly into a block.
00:26:12.660
The raw option in JSON generates output in a format that Speed Scope can understand. The system call here shells out our profile file to Speed Scope. So, if we start to profile in our application file, we can get a pulse on what our app is doing at startup.
00:26:30.300
After we’ve required gems and before our app class is defined is a good place to start. Then we can stop when the application is fully initialized. Using these two `if` statements, we can capture the entire boot process in our profile.
00:27:01.920
Since we aren’t leveraging Rack Mini Profiler anymore, we need to use our own instance of Speed Scope. Luckily, it can be downloaded via a node package. After adding Speed Scope to our app, we’re ready to start profiling.
00:27:23.760
We can start our server with the `boot_profile` environment variable to get a profile to open up in our browser. It should look something like this. If you look closely, there’s something called Spring in our call stacks.
00:27:38.640
Most Rails apps use the Spring gem to start up faster. Spring boots your server once and then keeps it running in the background for future requests. Unfortunately, this can skew our profiling results due to the hidden nature of Spring, leading to a lot of confusing scenarios. A lot of people on the internet dislike this gem and will tell you to remove it from your project.
00:28:07.440
This, however, is bad advice; as your Rails app grows, Spring will save you a lot of time in standard development flows, so please don’t remove it. To bypass Spring for profiling, we can use the `DISABLE_SPRING` environment variable to get more accurate data.
00:28:29.460
With Spring disabled, if we do a boot-time profile again, we can see that Spring is no longer in our call stacks. Now that we're profiling boot, we notice that our app startup time has regressed by multiple seconds. Something needs to be done! Profiling boot, we can see a severe regression related to reading network buffers.
00:28:51.840
If we look a little ways at the stack, we can see that our ShippingRates initializer is the problem. It looks like something is hanging when downloading shipping rates. Let’s take a closer look at the module to find out more.
00:29:09.680
The download rates method creates a network client and makes a request for shipping rates. This request is probably timing out. Our app needs to know how much to charge for shipping, but it doesn’t need to make this request on every boot.
00:29:38.400
There are a few ways to handle this scenario, but an easy way I can think of would be to make a rake task. This will allow us to treat shipping rate downloads as an isolated workflow.
00:29:55.720
We can then optionally run this task during production deployments or manually during development. We may also want to increase the read timeout for shipping rate downloads if we find the connection is constantly timing out. With shipping rate downloads taskified, we can see that we’ve shaved off nearly four seconds from our boot time; this is a huge performance win! Oh wait, there’s more.
00:30:50.520
Let’s take a closer look at how shipping rates are downloaded. Depending on the file size, we could be writing a rather large string. This is a good excuse to try out Memory Profiler. We can wrap the content of our task and see what the report says.
00:31:18.760
If we rerun the shipping rates task, we can see about 3.1 megabytes of allocated objects and 1.5 megabytes of retained objects. That’s a bit large. Instead, we can stream the content and build the shipping rates file line by line. Here we can open the file in append mode and stream the HTTP request gradually. This should hopefully cause fewer string allocations.
00:31:59.220
Sure enough, we’re down to about half the original allocations, at roughly 1.5 megabytes allocated and only a few bytes retained. The size of the file hasn’t changed, but the amount of times we built a representation of it in memory has. As a side note, the new code is also noticeably faster.
00:32:15.600
While debugging the last issue, you notice another initializer that’s showing up in our profile. Why would that be? Taking another boot time profile, we can see a sizable chunk of time taken up by the TaxService. We can also see the code that triggered this load is the TaxService initializer.
00:32:41.460
This is what the initializer looks like. The two prepare callbacks safely autoload code after boot and when the app needs to reload after a change. We need to find a way to keep track of the values we want to set but defer loading the class until we actually need to use it.
00:33:16.940
I should mention that Rails 6 revamped autoloading with a new gem called Zeitwerk. It replaced the classic autoloader which had several drawbacks. One of Zeitwerk's features is the ability to define load hooks for any constant it loads, allowing us to reference Zeitwerk auto-loaded code, including classes for external engines.
00:33:50.440
Using a Zeitwerk on-load callback, we can defer initialization until the class is referenced. This saves a lot of time in code loading and any upfront costs with initialization. After updating the initializer to use on-load callbacks, we can see we’ve shaved off about half a second. While this isn’t a huge improvement, it’s important to be conscious of what constants you’re referencing in large codebases.
00:34:28.040
Now, most of our boot time is taken up by Rails, which is good. However, you notice another place where code loading is slowing boot down—this time, it's in the app’s monkey patches. This is what our patches look like: each of these constants are autoloaded, which means that Ruby will wait to load them until they’re referenced.
00:34:50.760
We need to wrap the first patch in a callback to wait for Active Storage to append to our load paths. For the first patch, we can replace the two prepare callbacks with the Zeitwerk on-load hook, but this won’t work for Action Controller and Active Record since these classes don’t use Zeitwerk.
00:35:23.820
It turns out that autoloading and reloading constants can be somewhat confusing. It's a big reason why Rails is regarded as a magic framework. If we take a look at the guide for loading constants, we can see mention of an Active Support on-load hook. Active Support on-load hooks allow you to attach to a load event by name, and the block will be executed when called.
00:35:50.060
Taking a closer look at Rails, we can see these load hooks sprinkled throughout the framework. Typically, they're defined at the bottom of core class files. As you can see in this graph, there are a lot of hooks to choose from. An important note to make here is that autoloading isn’t a feature exclusive to Zeitwerk or Rails—Ruby allows you to autoload any code with the standard library's autoload method.
00:36:32.940
Zeitwerk actually uses Ruby's autoload method under the hood, and the difference is that Zeitwerk automates the process of autoloading by defining load paths and using file naming conventions. With Active Support's on-load hooks in place, we're able to defer Active Record and Action Controller loading.
00:37:15.780
You may notice a key difference in style between these callbacks: Zeitwerk callbacks aren’t evaluated in the context of a class, whereas Active Support callbacks are. We can verify we’re down about 150 milliseconds. While this isn’t a huge victory, these sorts of code loading issues can really add up.
00:37:34.660
Now that your app is speedy in both development and production, both you and your users are happy. Life is good—until one day, you receive a complaint about big shopping carts being slow to load. No problem, you think to yourself; you’re quite good at fixing speed regressions at this point. Bring it on!
00:38:10.740
However, you try and try, but you can’t reproduce the problem locally. At this point, you start to sweat. Sometimes performance issues can be hard to track down locally. For situations like these, profiling can simply be used on deployed production systems.
00:39:04.560
Let’s take a look at how to instrument production profiling with Rack Mini Profiler. We can authorize profiling in production with the `authorize_request` method. This has no effect in development because profiling is always authorized there.
00:39:44.600
Plugging it into our application controller, we need to pair it with some kind of authentication method. If your app has the concept of Administrators, this is pretty easy. Our app doesn’t, so we’re going to need to permit specific static IPs instead. However, you could use simple HTTP auth or some kind of identity management—whatever you have available.
00:40:17.520
After building up a big cart and profiling the page, we can see an issue stemming from the cart item model, specifically the product association. Taking a look at our cart view, we render our cart item partial for each item, which means the page will execute a query for every item in our cart.
00:40:48.600
Some more experienced developers will recognize this as an N+1 query. Now that we have a rough idea of the problem, we can start looking for a solution. If we search the Active Record querying guide, we’ll find the `includes` method that will solve our problem.
00:41:11.760
If our cart is set in code in our controller, we can use the includes method on the model class to ensure the product association is loaded with the least amount of queries. Switching back to development mode, we can see a change; even small carts are noticeably faster. This is a good indicator that our fix will help with production issues, but what if we wanted to prove that our change doesn't buckle under large amounts of data?
00:41:57.080
A good tool to leverage here is benchmarking. With benchmarking, we can easily measure performance changes between two code paths or methods. As it turns out, Rails also has a tool to help us out here: the Rails generate Benchmark command has everything you need to start benchmarking your own code.
00:42:55.839
The Benchmark generator was added in Rails 6.1, but you can achieve the same effect by creating benchmark scripts by hand. You’ll notice when running the command, it adds something to your Gemfile: this is the Benchmark IPS gem. Benchmarking is an expansive topic worthy of its own talk, so I’ll keep this brief.
00:43:47.640
The IPS in Benchmark IPS stands for iterations per second. The gem essentially runs the code blocks you give it as many times as possible and counts how many times the blocks were able to run. If we open the generated script, it looks like this. We can see that we’re using the Benchmark IPS gem to test two code blocks named ‘before’ and ‘after.’
00:44:39.479
If we define a test cart with products and a method for querying, we should be able to accurately compare loading methods. Because this is just a test, we don’t actually want to persist these records; for these situations, transactions are our friend. We can wrap our operations in a block and tell Active Record to roll back afterward, reverting any changes we make to our development database.
00:45:23.100
Sure enough, if we run the script, we’ll see something like this: loading with includes is about 10 times faster! If we increase the cart item count, the savings only get better. Eager loading queries is definitely worth the extra code.
00:46:12.660
So, with that, we’ve reached the end of our story. We’ve got a lightning-fast Rails app and we’ve learned a few important lessons: you can use Rack Mini Profiler, Memory Profiler, Stack Prof, and Speed Scope to find performance problems anywhere in your Rails app.
00:46:50.380
You should use Active Job to defer work from the request-response cycle. You should use caching to perform expensive work once that can be reused later. Code that makes sense in production may not make sense in development or test mode. You should bypass Spring for more accurate boot time profiles, and you should memory profile complex operations to minimize allocations.
00:47:47.280
Be aware of the code that you’re loading and use callbacks when necessary. You should use production profiling to arrive at solutions faster, and you can use benchmarking to assert speed differences between blocks of code.
00:48:30.620
Many of the issues discussed in this presentation were based off of real code. The app we worked on is available on GitHub for your reference, including some bonus content. Check the description for the link and links to other web pages I referenced in this talk.
00:48:58.020
I'll end off with some thanks. Thank you to Ruby Central for allowing me to present this talk. Thank you to Shopify and my colleagues for supporting me throughout the making of this talk.
00:49:07.080
Thank you to all the maintainers of the great gems we talked about today, and thank you for watching. I hope you learned something, and I hope I've inspired you to try profiling with your Rails applications.


