00:00:12.799
Good afternoon. My name is Philippe Hanrigou, and I want to tell you about my Mongrel clusters. Most of the time, I have a wonderful relationship with my Mongrel clusters, but sometimes they just stop responding to me. They don't take my requests anymore, and in this case, it's a little lost. I'm often left wondering how I should feel about it and what I can do about it. That's pretty much what I want to cover tonight.
00:00:36.180
Now, what you can do when your Mongrel cluster is misbehaving and you cannot figure out what's going on? In case you're still wondering about my accent, yes, I'm French. I work for a company called ThoughtWorks, which specializes in agile consulting and exciting technologies like Ruby. I published a book with Addison Wesley on the topic of Ruby troubleshooting, covering how you can leverage system tools like lsof, strace, and GDB in the context of Ruby.
00:01:00.600
You might also know me for my involvement as a creator and main author of Selenium Grid. By the way, we need to talk about vital Selenium tests, because there is definitely a way not to do that. Selenium Grid is a tool that lets you run your Selenium tests in a distributed manner across multiple machines so you can run your tests in a much shorter time. Instead of waiting three hours for your test suite to finish, you might only have to wait 10 minutes.
00:01:37.860
The journey that brings me here tonight dates back to about a year and a half ago. Patrick Farley, who did the presentation on internals with myself and a couple of other ThoughtWorks colleagues, was working on a pretty ambitious web services project that was dealing with a lot of databases and multiple web services, all under a pretty aggressive user load. The velocity was quite high until we started assessing the stability of our application and realized that our instances were getting stuck and freezing quite consistently, unfortunately, at random times and for random requests.
00:02:26.400
Just looking at our logs and trying to instrument Ruby, we found ourselves unable to get anywhere close to identifying the problem or the root cause. This is when Pat Farley, who was the tech lead at the time, came to me and a colleague named Joseph Miller and said, 'Hey Philippe, Jason, we need to solve this stability problem quickly.' We responded, of course, but we were thinking, 'We don't even know where to start.'
00:03:02.520
When you have a tough problem on your hands and you don't even know where to start, it's often good to ask for a little help from your friends. We are a big software community, and there are plenty of people who could help us. So we went around and asked our PHP counterparts and desperate Troopers. We even asked Java developers, who are typically very powerful but sometimes quite heavyweight.
00:03:35.580
It turns out these folks couldn't really help us much. They said, 'You need to think about who you are as Ruby developers.' So let's think about who we are. We're nimble for sure, we're moving fast, we have style, we have values and principles, and, more importantly, we have the Force! So who can we be? Well, we can be Jedi!
00:04:00.660
The cool thing about being a Jedi Ruby developer is that life is easy, right? Whenever we encounter problems, we just use the Force. A little Ruby trick here, a little script in the console, checking the logs... and we solve our problems in no time. This approach usually works for us 99% of the time, but sometimes we find ourselves in real-world trouble, usually in production environments. Not only are we in trouble, but during these cases, we need to solve the problem quickly, and the entire team is counting on us.
00:04:35.080
Does that sound familiar? It’s a bit like Luke in his mission to destroy the Death Star. When you find yourself in such a situation, it’s good to remember that even a Jedi is never alone. Even while concentrating on your task, there is always someone in the background helping out. Do you remember R2D2? We have our own little R2D2 as Ruby developers.
00:05:01.920
We have someone who keeps our Ruby applications running all the time, even if we forget about it. It’s called the operating system, Unix for most of us lucky ones. It turns out that there are a lot of system tools that Ruby developers might not know about, but they're well documented. Among these tools, there are many useful ones: lsof, iostop, strace, and whatever other tool you might name.
00:05:53.700
Something you might not know about is that there are tools that provide not only system level insights but also yield information about what’s happening in Ruby applications at the same time. This capability allows you to correlate information easily and see what’s going on. Tonight, I’ll concentrate mostly on two of these tools that give you insights into what’s happening in Ruby as well as in your system.
00:06:40.980
The first tool, unexpectedly, is GDB, the GNU Debugger. Acting as a C debugger, GDB can tell you everything that is happening system-level, like system calls and signals—essentially everything happening in your Ruby interpreter as well. With a few clever macros, you can also use GDB to obtain backtraces, raise Ruby exceptions, or even evaluate arbitrary Ruby code, which is pretty cool!
00:07:29.580
You guys want to see that tonight? Let's try to get started.
00:08:01.680
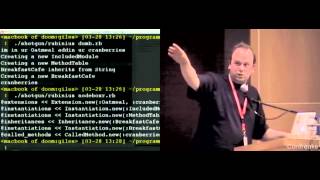
Tonight, our demonstration will mostly happen in a terminal. I have a Rails application which I'm going to launch. Here we go. So, I’m going to try to find it and call three actions in one controller. The first one I'm going to call right now is basically just sleeping and returning. As you can see, my action is working; my Mongrel cluster is happy and up and running. Then, something is going to happen. Actually, let me start over again because I forgot one critical step.
00:09:36.840
When you start to target your Mongrel process, it suddenly doesn’t respond anymore. By the way, it is never Mongrel that is the problem. Every time I investigate these troubleshooting problems in production, it’s never Mongrel; it’s always your code, Rails, your database, or your system. Mongrel is pretty solid in that regard. So when you find yourself in such a situation, let's try to use GDB to attach to the process. First, we need to know the process ID (PID). I’ve got my PID, and now I'm going to try to attach to it.
00:10:32.160
Now we’re in GDB, the C debugger, so I can see what's going on at a system level. Let’s try to get a backtrace. I’ve got my backtrace, but looking at it won’t tell me much because I see a lot of Ruby values I recognize. What’s more interesting is looking at the top of the stack to see where I’m stuck. If I repeat the action, it will be easier.
00:11:31.800
Ah, that's what I'm blocked on! I’m trying to get a lock on a file. This seems to be the result of some Blackmagic that is causing the issue. I vaguely remember that I’m utilizing a native gem called Blackmagic, but which controller is causing this? Wouldn't it be cool to be able to get those active backtraces? What movies came up in this C-level backtrace? Let me try to go to my process.
00:12:38.640
I’m going to kill the process here so you can see the output. Now, there is a pretty neat macro made by Mauricio Fernandez which allows you to evaluate Ruby code right from GDB, so let's test this out. That works! I’ll show you something else.
00:13:19.740
Maybe that would be a good way to get a backtrace. If I call 'caller,' sure enough, we have our backtrace. If I scroll up, I can see that I'm in my controller showcase, specifically in line six. The action I am executing seeks to provide business value. By checking my code, I'd quickly realize this is the part of the code that uses the Blackmagic gem. You might argue that it would be nice to know which file I'm trying to lock on, and that would be a great job for lsof. But we’ll leave that to another discussion.
00:14:19.740
Now, if I can evaluate arbitrary Ruby code, I can even evaluate the caller, which is pretty neat. But I can take it even further! I could check for every single object in my web instance, for instance. That's not super useful, but you get the idea. On the same principle, I could try to evaluate how many classes I have in my system and walk through the object space to see how many of each we have.
00:15:00.780
When attaching to a process with GDB, keep in mind that I could show you something else, but if I try to control-C here, I won’t be able to exit it. That’s because GDB is locking onto your process, so first, you need to exit from GDB. Now, a small side note: for GDB to perform its magic, you need to access the debugging symbols of your process.
00:15:44.760
Typically, this isn’t an issue if you’re on Linux or Solaris. However, if you’re using the out-of-the-box Ruby interpreter on Mac OS Leopard, it’s not compiled with debugging information. If you want to perform these types of tricks, you’re better off compiling Ruby with the debugging flags enabled and using it to troubleshoot your problems.
00:16:57.160
Let’s review a bit. First, let’s give credit where it’s due: all of these amazing macros were not made by me. I would love to take credit, but I can’t. They were created mainly by James Buck and Mauricio Fernandez. I’ll share how you can access them later; they are really awesome because they effectively reimplement eval as GDB macros.
00:18:05.240
So, how can you get these macros? You can find them in various places on the internet, but the easiest way is to visit my website, ph7sport.com. On that page, you’ll find a download link to get all the macros compiled together with additional documentation. Save it as .gdb in your home directory.
00:18:48.480
Now, what kind of macros can you find? One of the most important ones is 'all be finished.' Basically, it doesn’t perform any actions by itself. It places you in a safe state because you might attach to your process in a state that isn’t safe to run arbitrary code. So, 'all be finished' takes care of that and controls the safe state. Another macro is 'eval,' which lets you evaluate arbitrary code, especially useful for 'caller' when you're in trouble and want to get the stack traces.
00:19:49.920
There’s also a way to capture the Ruby backtrace—not the C one from GDB. Interpreting the C-level backtrace doesn’t always work, so when it fails, utilize 'eval caller' followed by 'raise' as a neat trick. That’s a quick run-through of the macros available to you.
00:21:12.240
So, what can you do with DTrace and what type of providers are available? If you have a MacBook Pro running Solaris, just run 'sudo dtrace -l,' and you will see all the providers available. There are many that can cover everything from kernel-level providers, such as system calls, to network stuff and even language interpreters.
00:23:25.440
Ruby developers can trace every significant event. DTrace gives you visibility into high-level application calls all the way down into kernel activity. With DTrace, you can see everything happening in your system, from high-level constructs to the deepest kernel internals, which is incredibly powerful.
00:24:35.560
The most exciting part of DTrace is that you only need to learn one tool to monitor everything in your system. Instead of separate tools providing information in different formats with different context, DTrace allows you to correlate all that information. It gives you the ability to answer questions that are difficult to achieve when investigating production issues.
00:26:55.240
Just as GDB is a powerful tool for frozen processes, DTrace is the opposite. It has the ability to capture dynamic aspects of your applications. Think of it like motion capture; you can monitor probes in your applications like you’d use sensors in a motion capture outfit.
00:28:40.200
Let me ask you, how many people here are familiar with DTrace? Not many, it seems. And how many are aware of the D scripting language? Similar situation; a few hands raised. I’m going to cover a bit of introductory material to ensure everyone is on the same page.
00:30:40.200
DTrace works with what we call probes. A probe acts as a sensor placed in your code at points of interest. You can enable or disable these probes on demand, minimizing performance impacts when they are turned off. This means you can run DTrace in production with probes disabled until you need to gather information, making it incredibly efficient and practical.
00:31:55.680
In terms of implementations, since DTrace is open to various systems, you could create specific probes for the areas you're interested in. This shows you how to write a simple DTrace script for capturing and analyzing data in your system without negatively impacting performance.
00:33:02.280
By providing a way to listen to events in your applications, you can analyze performance metrics and see where bottlenecks are occurring. You can watch as time is spent on various processes within your application, allowing for clear insights into potential issues that may arise.
00:34:24.000
The great thing about this process is that you have an opportunity to refine your understanding progressively. For instance, if you notice that a request is slow, you can investigate which methods and system calls are concurrently running, drilling down until you pinpoint the source of the delay.
00:35:50.520
DTrace provides you with both the visibility to notice issues early on and the tools to analyze them effectively. For instance, if you set up probes for specific actions in your Ruby application, you could actively observe its performance metrics.
00:37:15.840
In conclusion, once you’ve set up all of this infrastructure for monitoring and capturing data, you will find it illuminating for performance optimizations in all aspects of your Ruby applications. As you work through these scenarios in real time, you’ll become adept at diagnosing issues before they escalate into major problems.
00:38:58.080
If you take nothing else from this presentation, please remember: don't wait for production issues to land you in hot water. Don't let the emperor take away your Mongrel clusters without training up your skills to handle problems before they arise. Regularly familiarize yourself with existing system tools in your daily work.
00:39:27.720
This includes tools like lsof and iostop, which can provide useful insights. If you get used to using them, you will find it far more manageable to troubleshoot problems during critical incidents without the pressure of unfamiliarity.
00:40:44.400
Furthermore, notably, I recommend installing the DTrace utilities; you'll get all this implemented right out of the box, which helps streamline the setup process. Explore available documentation and tutorials, as they give you meaningful guidance on how to use tools effectively!
00:41:50.640
Thank you very much for your time! Now, if you have any questions, please feel free to ask.