00:00:18.390
Greetings, humans from the 21st century! Today, I'm going to talk about debugging, which is always a relevant topic. In this case, we will focus on time-travel debugging.
00:00:25.990
Let's start with the basics. My name is Brock Wilcox, and my contact information is way down here. I also work for OpToro, where we help retailers manage their returns. They paid for me to come here, so let's get started!
00:00:36.310
However, they do not pay me to do mad science unless I can make it practical, so we will work on that.
00:00:56.130
I assume you all use debuggers, right? There are many styles of debugging, but my classical favorite is log-based debugging—printing out values at various points in the code. Then there are interactive debuggers, where you can step through your program.
00:01:10.030
So I’d like to conduct a little poll. How many of you use a debugger regularly? That’s pretty impressive! This is Ruby land, and I want to talk about the favorite debugger in Ruby, which is Pry and its extension, Bybug.
00:01:22.330
Bybug is the new debugger introduced in version 2.0. As experts in debugging, you may find this redundant, but I don’t mind repeating myself. Let's dive in!
00:01:43.060
Here we have a simple program where we pull in our debugger and the binding.pry statement. Hopefully, you are all familiar with this. It drops you into a nice REPL and shows you the line of code you haven’t executed yet.
00:01:57.299
From here, you can look around the state of your program and perform calculations. However, at this point, variable 'x' is not defined yet. After running some code, we find that 'x' finally takes on the value of 7. It's a handy tool that I highly recommend to anyone who isn’t currently using it—add it to your Gemfile immediately!
00:02:28.990
In Ruby, there's intermediate bytecode that can be explored in great detail in the book 'Ruby Under a Microscope.' Understanding this interoperability is crucial to leveraging the power of Ruby debuggers.
00:02:43.720
The process involves the Ruby interpreter using trace lines for introspection. When a line is hit, the interpreter checks if it’s a breakpoint and can expose an API for third parties to tap into.
00:03:00.810
What Bybug does is hook into these trace lines and use the Yard API to execute a callback every time a line is executed. You can check out how this internal mechanism works within the code provided. It adds hooks at all points in your code where you might want to break.
00:03:36.280
Let’s take a moment to appreciate how useful this is. Now, moving on from this primitive technology, we can apply some mad science!
00:05:10.930
I created a gem called 'pry-time-travel' that lets you go backward in your debugging processes. You can type commands like 'next' or 'step', and if you make a mistake, you can go back to a previous line without losing what you've done.
00:06:09.470
For example, if you mistakenly edit a line, you can type 'back' to return to the last line that hasn’t been executed. At that point, ‘x’ will hold its original value—7, not 42.
00:06:17.090
This ability to go back gives you incredible control during debugging. You can change anything and effectively rewrite history, at least within the confines of your program.
00:06:38.750
Now, let's delve into how exactly this is accomplished. The concept is derived from the multiverse theory, where each action splits the universe into another version.
00:07:00.840
So, each time you execute an action, such as typing 'next,' a new universe is created, which can be suspended and saved for later use. This allows us to create snapshots of program states and revert to them later.
00:07:44.600
In practice, the model involves keeping track of these snapshots as a tree structure, allowing you to roll back to any prior state, akin to a time machine.
00:08:35.390
Two essential components are required for this time travel: the fork—the ability to create child processes—and signals, which are callbacks sent from the operating system.
00:09:11.669
The fork call creates a new process by duplicating the current program, while signals help synchronize actions across these processes.
00:09:49.030
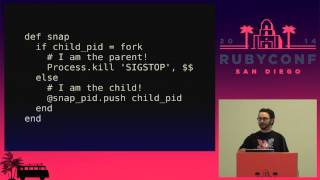
When you fork a process in Ruby, you get the child process ID in the parent process or none in the child, which creates a relationship between them. These processes can run simultaneously, which makes managing your debugging environment complex but powerful.
00:10:36.480
Now, let’s look at signals. Each signal has a specific purpose, such as handling Ctrl+C (SIGINT) or terminations (SIGTERM). Knowing how to manage these signals will greatly enhance the efficiency of your debugging.
00:11:05.000
In Ruby, you can register callbacks using the Signal.trap method, which allows you to handle signals more gracefully and avoid crashing your program unexpectedly.
00:11:36.260
However, one must be cautious with callbacks because, while they execute, they can be interrupted by other signals leading to unpredictable behavior.
00:12:07.080
One of the most powerful signals you can utilize in your time travel debugging is SIGSTOP, which allows you to pause a process without killing it, giving you the chance to return to its state later.
00:12:35.090
With the right setup, you can not only stop a process but also resume it later, thus further enhancing the debugging workflow.
00:13:03.710
The core functions of this time travel system will be 'snapshot', which creates these process states, and 'restore', which allows you to revert to a previously saved state.
00:13:39.100
Keep in mind that time travel has its limitations. You can’t go back to pre-snapshot moments. You are only allowed to revert back to the last snapshot created, akin to time travel in science fiction.
00:14:17.000
Moreover, shared file handles can complicate multiprocessing in Ruby. If a child process exits and closes a shared file handle, the parent process could lose access as well.
00:14:55.180
Any outside state changes also won't be captured when you snapshot, limiting your ability to restore the original state completely.
00:15:32.670
Your main thread will copy when you fork, but other threads may not be, which limits the complexity of this kind of time control.
00:16:30.800
If you want to manage threading during this process, fork correctly, and be aware of how it impacts the overall state of your debugging.
00:17:15.220
Let’s look at how this works in practice. Whenever a snapshot is created, the system tracks the process relationships and manages hanging processes appropriately.
00:18:00.300
In effect, you can create intelligent structures that manage when to kill off processes and prevent lingering zombies from consuming resources.
00:18:45.250
As we delve deeper into time-travel debugging, it’s evident there are unique complexities. While it can genuinely assist in debugging efforts, implementing these systems requires deep knowledge of Ruby and how Unix processes operate.
00:19:25.810
However, with practice, you can utilize these systems to create profound debugging strategies that transcend conventional methods.
00:20:08.740
In conclusion, the concept of time travel in debugging offers us insights into managing our processes smartly. Next time you encounter an issue, remember that each action in debugging can create a branching path—you just need the right tools to navigate it.
00:20:52.750
Thank you for being here today and feel free to ask any questions about time-travel debugging or any associated concepts!


