00:00:24.000
Today, we'll talk about a simple approach to fixing a memory leak. But first, I'd like you to imagine a little situation. Let's say you're a developer working on a Rails application, and one morning, you notice that one of your app processes is crashing because of excessive memory usage. The catch is that you have no idea when it started. Your application monitoring tools aren't much help, and you have literally dozens of files that could be responsible for this. My name is Vincent Rolea, and welcome to my life.
00:00:53.940
A few words about myself: I come from a town in France called Roubaix. If you enjoy cycling, you might have heard of it because of the famous race known as Paris-Roubaix, which goes from Paris to Roubaix. I'm a senior product developer at Podia and am fortunate to be married to the wonderful Aurel, who has been incredibly supportive and encouraged me to apply to talk at this conference. You can see a picture of us near the Cliffs of Dover in England; it was a sunny day, which is rare enough to be worth mentioning in England.
00:01:29.820
You can find me on various platforms: on Twitter at @vincentrolya, on the Ruby social platform at @vincent, and even on Mastodon at @vrolea. Yes, that's a lot of animal themes!
00:01:45.540
A few words about Podia: we like to think of Podia as a one-stop shop where you can find everything you need to sell courses, host webinars, and build community. I would like to extend my thanks to the project team for supporting me to be here, especially to our CTO Jamie and all the developers, some of whom are in the room today. Their help and feedback have been instrumental in putting this presentation together.
00:02:10.800
I’m really happy to be in Atlanta today. I nearly didn’t make it, though, as my flight this morning was canceled. I received a nice text from Delta saying, 'Yay, your flight is canceled, and we don’t have any replacement flights!' That was a bit of a problem, but I eventually made it, and I’m thrilled to have the opportunity to talk to you today.
00:02:30.959
Now, speaking of the conference, this talk isn't about my journey to Atlanta, though I'm sure you'd love to hear more about that. Instead, while the talk does touch on memory management, it isn’t centered on how Ruby manages memory specifically. If that’s your interest, I highly recommend checking out some of the renowned speakers who address that topic.
00:02:52.739
So, what is this talk about? This talk is about methodology and how to take a complex problem and break it down into simpler parts. It's about taking a step back rather than diving in immediately. Of course, you will see Ruby code in this presentation, and yes, the problem we are discussing relates to memory. However, the techniques presented here could be applied in other programming languages and fields as well.
00:03:18.239
To kick things off, let’s revisit our little thought experiment from the beginning of the presentation. It turns out, what I described really happened a few months back. Every few weeks, developers at Podia enter what we call our support dev rotation. During this week, each pair of developers dedicates time to fixing bugs reported by our exceptional customer support team, and they also work on technical improvements such as addressing technical debt, refactorings, and all kinds of updates, particularly performance ones.
00:03:43.700
During my support dev week, one specific ticket caught my attention. This ticket, written by our CTO Jamie, was about one of our background worker processes exceeding the one gigabyte memory limit. Jamie noted that he encountered a static shutdown error, and the worker was exiting due to exceeding its memory capabilities. Given that the memory consumption continued growing, he suspected there could be a memory leak.
00:04:26.520
Attached to the ticket was a graph from Heroku metrics. At the bottom, you can see the average memory usage of the worker over time, with the event timeline presented at the top. In the lower graph, a few features caught our interest. The first was indicated in red rectangles, displaying sudden spikes in memory usage, typically the result of many instantiated objects during the job execution. We refer to that as memory bloat. The second feature, represented in blue rectangles, indicated a slow but steady increase in memory usage, which Jamie referenced in the ticket; this was the trend that raised our concern.
00:05:47.220
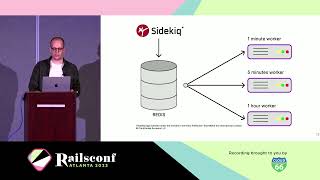
This ticket piqued my interest because memory problems are often mistaken for memory leaks. So, is this a real memory leak? To determine that, we must understand our background processing infrastructure at Podia and how it operates. Currently, we use Sidekiq for our background processing needs. We distribute our asynchronous jobs across three different types of workers, each handling one or multiple queues, and we try to dispatch jobs to the respective worker based on their expected execution time.
00:06:03.800
For instance, jobs expected to complete in under a minute are allocated to our one-minute worker. Similarly, jobs anticipated to take less than five minutes are assigned to our five-minute worker, while the larger and more demanding jobs are directed to our hour-long worker. This setup has several advantages. First of all, we can establish different latency expectations for our various worker types. This means that if the latency on our one-minute workers climbs above one minute and thirty seconds, we are alerted that there's an issue.
00:06:36.779
Additionally, we can scale our workers independently. For example, if we have a substantial job that requires completion and a significant migration to perform, we could send this to our hour-long worker and possibly scale it, both vertically and horizontally, ensuring a quicker turnaround.
00:06:57.600
Unfortunately for us, the issue noted in the ticket occurred on our one-minute worker—the one that requires the lowest possible latency. Revisiting the graph, we can see how this worker is set up: it is a standard 2x Dyno with one gigabyte of RAM on Heroku. It manages the default and mailer queues, which happen to be among the busiest at Podia. Furthermore, it has a concurrency set to 25, which refers to the number of threads started for each one-minute worker.
00:07:40.740
We’re trying to ascertain whether the behavior we've observed in the blue rectangles is due to a memory leak. So, we ponder if there are any configuration changes we could implement on the worker to confirm this. One obvious approach is to scale our worker vertically, which means allocating more RAM to it. So, we decided to upgrade our worker from one gigabyte of RAM to 2.5 gigabytes, and here are the results.
00:08:12.060
The results are less clear than our previous graph because the time scale is broader, but we do see that memory usage still overshoots its limits, consuming more than the 2.5 gigabytes it used previously. Therefore, it seems that vertical scaling did not resolve our issue. Perhaps we can modify another setting. We recognized that our workers were servicing two of the largest queues in our application—the default and mailer queues. By splitting the load between two different workers, we could potentially reduce our memory consumption.
00:08:57.480
Thus, we set up two distinct workers: one to manage our mailer queue and the other for our default queue. After implementing this, we observed our one-minute mail worker performing well, with its memory utilization plateauing, which was the goal we were after. However, our one-minute default worker continued to experience memory growth, and while it's not represented on the graph, it eventually overshot the limit and crashed.
00:09:27.240
This led us closer to thinking we indeed had a genuine memory leak on our hands. But was there anything else we could do to validate this? Yes, we could also reduce the concurrency of the worker. Twenty-five is quite a high concurrency setting for a worker, especially since a few months ago, Sidekiq lowered its default concurrency from 25 to 10. Although we were fairly certain we had an issue, we figured this would be a straightforward environment variable change worth testing. We reduced the concurrency from 25 to 15, but shockingly, we still encountered the same memory growth on our worker.
00:10:10.320
So, to sum up, we obtained a ticket raising the question: Is there a memory leak in one of our Ruby jobs? At this stage, we were quite convinced that there was. We had lowered the concurrency, split the workers, and increased their capacities, yet we attained no satisfactory results. This poses a crucial question for you: Is this worth fixing? The core of this talk is about pragmatism, so let’s be pragmatic.
00:10:50.160
Since the worker keeps crashing, jobs are merely returned to the queue. Once the worker restarts, it picks the jobs back up to perform them, and it simply works, right? However, we anticipate our app to grow over time. Thus, it’s likely that the worker will crash more often, leading to longer restart times, ultimately increasing our latency over time, which is not an outcome we desire. Since this worker is intended for one-minute processing times, we absolutely need to address this issue and identify the source of the leak.
00:11:33.020
Now, when faced with a complex situation, I often ponder how I could leverage my years of professional experience to find a solution. This time was no different. I started with a Google search. Ah, the classic; it always begins with a Google search, right? Well, we genuinely did conduct a Google search, as tools like ChatGPT were not available at the time. Through our research, we discovered three potential solutions for addressing our memory issue.
00:12:16.560
It turns out, regarding memory problems, there are three fundamental approaches to consider. The first one suggested using Rust. Thank you, internet, but no thanks. The second option was to utilize performance monitoring tools for our application, like AppSignal, Heroku, Scout, or New Relic. In our case, we utilize AppSignal, and we are quite satisfied with it.
00:12:57.260
AppSignal is a valuable tool, as it enables you to create graphs, such as the one showcasing the average memory usage of our one-minute worker over time. This graph was generated a few weeks ago. Spoiler alert: we managed to fix the issue! These types of graphs are fantastic because they allow you to connect specific behaviors to distinct points in time. More importantly, we could link this data to specific commits or deployments.
00:14:03.660
While it may not allow us to pinpoint the exact location of the leaking code, it can help narrow down the search to only a handful of files from a particular commit or deployment. However, in our scenario, we had no indication of when the issue began. We deploy our app five to ten times a day, and without sufficient time passing for the worker to exceed this memory before being restarted, we couldn’t effectively trace back to discover the source of the leak. Thus, we had to resort to our third option.
00:14:50.360
Our third option involved employing dedicated tools to help. You’ve probably heard of tools like Memory Profiler, Bullet, or Drip. These tools typically function by wrapping the code you want to instrument within a report block and outputting the status, providing valuable insights about object allocations and memory retention.
00:15:29.520
For instance, consider this example where we utilize Memory Profiler. Here, we have a straightforward case where we instantiate an array and continuously append a string a thousand times. After printing the report, we obtain pertinent information. These tools are incredibly powerful because they enable you to pinpoint precisely where memory was retained or where objects were allocated, among other metrics.
00:16:13.560
While this might appear promising for resolving our issue, it’s crucial to note that you need to know where to instrument your code. Looking back at our example, it seems straightforward as we have a strong sense of where the problem lies. However, the reality can be vastly different when working on significantly more complex applications.
00:17:02.200
In our case, we were uncertain where precisely to apply the instrumentation. Consequently, we would have to instrument all the jobs within our default queue. Therefore, we needed to determine how many jobs we needed to instrument.
00:17:44.580
To do this, we reviewed our jobs within our jobs folder. For our scenario, we assumed the faulty code resided in our application code and not within any third-party libraries. Our Gemfile is well maintained, so we could likely rule those sources out.
00:18:24.780
We were looking for jobs that were processed by the default queue, which meant we needed to retrieve the classes corresponding to those jobs. First, we obtained all the files within our jobs folder, as we determined the fault originated there. Once we gathered the files, we needed to identify the jobs associated with our default queue.
00:19:12.660
We did that by utilizing a method available on our job classes called queue name. However, to make this work, we needed to have the class of the jobs. By manipulating the file paths, we conducted some string operations, which included removing the file extension, splitting by forward slashes to acquire the namespace, and then camelizing and constantizing the classes using ActiveSupport Inflector.
00:19:35.540
After completing the necessary transformations, we simply checked if each job class corresponded to the default queue name. Here’s a glimpse of that process—checking if the job class has a queue name. This was an edge case for jobs that don’t inherit from the application job, but we only had a few of those, and fortunately, they were all included in the default queue.
00:19:54.720
When we evaluated the size of our jobs queued under the default array, it turned out we had 120 jobs within that folder, each requiring their own set of arguments and contexts. This led us to question if there was a more efficient way to address our situation.
00:20:28.840
As a pragmatic product developer, my primary focus should be on products and not on low-level tasks like instrumenting and analyzing memory reports for 120 jobs. While project deadlines might be pressing, a colleague may need my assistance with something, or I might have a significant feature I’ve been working on due for launch. It’s a saying I resonate with: if you don’t like how the table is set, turn it around. Therefore, it was time for us to reconsider the problem from a different perspective.
00:21:27.700
How did we approach this? We began to think about the real issue we wanted to rectify. Did I need to know precisely what was causing the issue? Honestly, no, it wasn’t my priority. I didn’t require detailed instrumentation immediately. All I needed was to identify which job was causing this mess.
00:22:36.820
Interestingly enough, the solution was right in front of us all along. Do you recall when we split our workers, with each one servicing a different queue: our mailer and default queues? After examining the graphs, we could see that the problem did not lie with our mailer worker. This suggested that the issue was within our default worker.
00:23:02.300
So this raised another idea: could we take some jobs from our default worker and temporarily park them in another queue to analyze their behavior? This led us to introduce what we termed the quarantine queue. Let’s visualize this setup: we have one default queue serving four jobs and a quarantine queue that serves none. Each queue operates within its own worker. As it turns out, our default queue is leaking memory.
00:23:58.640
After moving half the jobs to the quarantine queue, we witnessed an immediate change: the default queue was leaking, while the quarantine queue remained safe. With this data, we deduced that our jobs one and two were sound, while jobs three and four needed further inspection. Next, we returned jobs one and two to the default queue, re-examining the remaining jobs in the quarantine queue. When we tested this again, job three was the lone culprit while job four operated without issues.
00:24:59.420
Many of you might recognize this strategy; it resembles a classic binary search technique. This is relevant, especially because binary search exhibits logarithmic complexity, while individually instrumenting each job would mean a linear complexity. When you handle larger data sets, binary search minimizes the number of tries needed to discover the leaking job.
00:25:45.320
Now, the theory behind this has shown a lot of promise. But how do we translate these concepts into_ actionable steps in practice? Our aim was to dynamically redirect specific jobs into quarantine to isolate suspicious behaviors.
00:26:12.840
The Active Job API outlines the approach to set up queues. Rather than manually changing queue names each time and making commits, we sought something more efficient. The goal was to intercept jobs during their journey to Redis for redirecting as needed. Thankfully, Sidekiq provides a built-in capability for this: Sidekiq client middlewares.
00:27:06.360
A Sidekiq middleware is fundamentally a class that responds to a call when the Sidekiq client enqueues a job, passing the associated arguments. The middleware can process the job as needed: logging, altering the job queue, and then yield control to the next middleware in the stack with the same arguments.
00:27:41.160
Our responsibility is to acquire the enqueued job, determine whether it needs to be quarantined, and, if so, modify its queue accordingly. Initially, we capture the job and assess it based on a predetermined list of quarantine eligible jobs, set as a semicolon-separated string in an environment variable. Though we recognize there are possibly better methodologies, this was a quick and effective way for us to test our implementation.
00:28:18.360
Now that we have our job class and a list of jobs to quarantine, it's a straightforward check. If the job class exists within our quarantine jobs list, we simply assign it to the quarantine queue. Next, all that remains is to add the new middleware class to the middleware chain in the Sidekiq configuration file.
00:28:55.920
Once we completed the process of adjusting our queue implementation, we found a batch of seven to eight jobs in the quarantine queue. Interestingly enough, however, our review of the logs indicated that only one of those jobs had been invoked, while the others were rarely called.
00:29:50.340
Eventually, we identified our leaking job: the event analytics job, which is responsible solely for sending analytics events to our service. This job is straightforward; it parses arguments and performs some manipulation, but critically, it instantiates a new analytics object with each execution and invokes a tracking method on it.
00:30:36.840
To summarize our solution: we removed the job because we decided that tracking analytics was not crucial at this time. The fix was incredibly simple; we simply read the documentation.
00:30:45.900
Upon reviewing the analytics gem's documentation, we discovered that it advised instantiating the analytics object only once and storing it as a global variable within an initializer. Acting on that recommendation, we added a segment initializer, instantiated the analytics object a single time, and designated it as Podia's global segment object. This way, whenever an event needed tracking, we could utilize and call track on that single instantiated object.
00:31:22.400
Consequently, we resolved the memory leak without having to dive into the specifics of what was happening. Isn’t that impressive? However, I get the impression that some of you may find this somewhat disheartening—you may have expected a more intricate resolution. Never fear, as now that we’ve rectified the issue, we have the liberty to investigate further and comprehend what transpired.
00:32:23.300
Do you recall the tools I mentioned earlier? Well, now that we know where to instrument our code, we can employ them—this is indeed a beneficial aspect. Let’s revisit our previously problematic job. Remember, it involved instantiating the analytics library and calling the track method.
00:32:59.300
We’re confident that the argument parsing isn’t responsible for the issue, as we’ve already ruled that out. Thus, our primary focus is concentrating on the last two commands: the instantiation of the object and invoking track on it.
00:33:26.600
To instrument that specific block, we utilized Memory Profiler once again, passing the code we might want to examine as a block and printing the resultant report. Thereafter, we observed the outcomes, where we discovered that the code encapsulated in our report block retains relevant objects tied to the analytics library.
00:34:05.920
Secondly, the report indicated that the line of code maintaining the most memory was line 182 in the client file. In summary, each time we called the instantiate track on our analytics client, it retained memory. Given that we are a successful application with numerous users, this operation occurs frequently, resulting in an accumulation of retained memory leading to the prior mentioned leak.
00:34:46.400
To ensure clarity, let's examine the Segment Analytics client Ruby file. This is the segment of our client code retaining the highest amount of memory, specifically the line in question. Here is a brief overview of how the client class functions: Tracking events are queued and processed asynchronously on a separate worker thread.
00:35:19.800
Thus, upon invocation of the track method, a new client object is instantiated, and the action intended to be tracked is pushed into the queue. Furthermore, we make sure that the worker responsible for handling the queue is active.
00:36:02.240
While I won’t delve into intricate details regarding thread safety and mutex synchronization, it's important to note that as new workers initiate within the block path to thread new and are assigned to the worker thread instance variable, Ruby blocks retain references to their current context.
00:36:37.520
This implies that the client maintains a reference to the newly created worker thread, ultimately making the client inaccessible for garbage collection since the thread holds a reference to it. In other words, the client becomes unable to free up memory, along with other objects that the client refers to, as observed in our memory report. Therefore, due to our decision to instantiate the library only once within an initializer, the memory leak was addressed and resolved.
00:37:30.240
Reflecting on this entire process, it’s far more acceptable for me to take the route of binary search in this scenario. Ultimately, what transpired was a complex issue that we addressed using a remarkably straightforward technique.
00:37:54.920
My greatest hope is that this case study will assist some of you the next time you encounter an overwhelming problem that appears difficult to resolve. Approaching the problem from a different angle often reveals rapid and simple solutions. That is the primary message I wish to convey to you all today.
00:38:19.060
Thank you for taking the time to listen. If you have questions or wish to engage in further conversation, please feel free to join me. Have a great day!


