00:00:13.120
Alright, yes! So I guess first of all, for my first regional talk, this is a subject I'm really excited about. I have a few things to go over before I dive in. I work at a company called Next. It's a great place; it's a startup.
00:00:24.519
I've been getting interested in data visualization. It's kind of a hot topic in technology right now. There's a lot of data docs available, which are huge repositories for all things government-related.
00:00:31.880
Some labs also provide a lot of tools and data themselves. Infochimps is a commercial offering; they have some open-source data.
00:00:37.120
I gave kind of a precursor to this talk, you know, a sort of testing-things-out talk, at my local user group, and they really liked the slides I prepared on code repositories. I think that's pretty cool too.
00:00:45.960
The means by which I was analyzing the code from my repositories was Grit. I think most of you remember Grit. It was kind of the first library that came out when GitHub was launching.
00:01:00.320
It was really cool because it was a library in Ruby that would interface with your Git repositories and provide you methods to interact with your repository.
00:01:08.119
The reason I liked using it for data visualization is that the data is very complete.
00:01:13.600
One of the things I found was that using some of the other sources, the data would often be really sparse. It might come in an Excel file or a CSV file.
00:01:20.560
One of the repositories I pulled down from data.gov was the energy data, and I found that interesting. I thought it would be cool to work with something topical.
00:01:26.479
However, I quickly discovered that there were all these really weird formats, and the data wasn’t where it was supposed to be.
00:01:34.320
You had to use six-digit codes to figure out which energy source and units were being used, so it got really complicated very quickly.
00:01:41.680
Grit also provides some nice basic built-in stats for commits, and it’s appealing because you have access to anything on GitHub concerning the code repositories.
00:01:49.240
I like having an engaging topic to talk about, and I thought code repositories would be more interesting to you than government data.
00:01:54.280
After all, government data could get weirdly political, especially if I had opinions about it.
00:02:00.960
Now, the first thing I was worried about with the data was having some sort of persistence layer.
00:02:06.960
I initially used the Grit interface to access all the commits and decided to work on a persistence method.
00:02:12.840
I thought this would be a nice way to access the data and ensure it was persisted properly.
00:02:18.480
One challenge I encountered while getting into the MongoDB stuff was messing up the data a lot.
00:02:24.080
I would overwrite existing data or create duplicates, and that sort of thing.
00:02:29.400
I thought exporting to plain text would be really nice, so I aimed to export to JSON.
00:02:35.560
This would provide easy importing into MongoDB and serve as a backup for the persisted data in case I messed anything up.
00:02:43.280
I also wanted to do some MapReduce, which is a pretty neat way to handle such tasks.
00:02:49.599
This was the short script I used for importing data. I utilized Ruby's MRI version.
00:02:56.599
I pulled down the repo, and the commit count is simply the total commits.
00:03:03.239
I navigated through each commit to import the data about those commits.
00:03:09.400
At this point, I’m just writing it out to a JSON file.
00:03:16.759
This was my original intention: to have a flat file representation that I could easily retrieve.
00:03:24.759
I found that I really liked persisting data with JSON, especially given the database options available now.
00:03:32.360
For instance, CouchDB makes it easy to import and export JSON.
00:03:39.960
After writing out that file, all we had to do was run a long import command and specify the database and the collection, along with the file.
00:03:46.639
It takes a line-by-line JSON file and imports it into the MongoDB, giving us access to all these commits.
00:03:53.120
This was kind of the first visualization. At this point, it's just a snapshot of the data I was extracting from the repo.
00:04:04.079
I show this slide because it's so simple to do this sort of analysis.
00:04:10.879
With all the data heads here, it seems we don't spend enough time examining the factual information about our repositories.
00:04:17.680
For example, does anyone know how many commits the Ruby repo has?
00:04:24.960
It's around 22,000, but some estimates speculate it's more like half a million.
00:04:31.760
This just offers some basic information. I want to show how I gathered this data.
00:04:38.760
I was just experimenting in the MongoDB console to extract this information.
00:04:45.559
You can see the queries are really simple, even if you're not a MongoDB expert.
00:04:51.760
Even though it's not super significant to my application here, it's simply the method I chose for this instance.
00:04:56.760
One amusing quirk is the sorting: you can see date1 is in descending order while date2 is in ascending order.
00:05:04.079
In approaching this data, just start simple. Begin with small queries to get the information you want.
00:05:11.960
Choosing visualization libraries is crucial. There are many options available.
00:05:19.400
Raphaël is one of the more popular ones, but I also like a project called Protovis by Matt B.
00:05:26.760
It's a library that produces SVG-style visualizations.
00:05:32.960
The syntax is great and very declarative, and they provide lots of examples and good documentation.
00:05:40.560
Matt B happens to be a Stanford professor, so he definitely knows what he’s doing.
00:05:47.679
This example shows how appealing the syntax is; you can easily call out properties like method calls.
00:05:54.399
Chaining methods elegantly leads to a long sequence of commands to produce the visualization.
00:06:01.760
This way of working with visualizations is very interesting, allowing us to build on previous commands seamlessly.
00:06:07.280
In this instance, the canvas is where we visualize our data by adding bars to represent the array.
00:06:14.120
From a first glance, it’s pretty straightforward, even if you haven’t used this library before.
00:06:22.720
The function dd* is a little tricky, but it’s nice since it allows closures within the chain.
00:06:29.480
You can access the current data within the array, making data manipulation efficient.
00:06:35.679
This is a very simple example of the kind of visualizations we're creating.
00:06:42.240
Now we have a slightly more complicated example, which is Ruby code showing the growth of the codebase over time.
00:06:53.720
This data reflects the size of the code and looks back over time.
00:07:01.320
In the slide, you can observe the year separations at the bottom.
00:07:09.880
The black spots indicate when more aggressive development occurred.
00:07:17.480
You can visually discern when the Ruby library was more active in its development.
00:07:24.080
I created a Sinatra app to access the data from our previous import.
00:07:31.680
It’s very simple, including MongoDB and setting up a route for repo commits.
00:07:38.760
I think at some point it would be cool to have a web service where you just input your repo and it displays this kind of data automatically.
00:07:47.480
There is one quirk in this code, which is the dollar sign followed by custom filtering for commits.
00:07:55.160
This gets all commits that change more than 300 lines of code.
00:08:02.960
Filtering out smaller commits resulted in a clearer graph, though I know dropping data isn’t ideal.
00:08:09.800
I went ahead with it to keep my slide clear while showing the most relevant details.
00:08:16.560
Next, I created a hash of the fields I wanted, ensuring I had more than enough data for analysis.
00:08:24.240
This view represents a snapshot of the analysis, ensuring we have a good overview.
00:08:32.480
I focused on the additions and deletions from the commits, looking for trends.
00:08:39.200
Here, we're managing running totals of changes over time.
00:08:46.880
The library I'm using provides great tools to normalize the data, making analysis more straightforward.
00:08:54.080
I’m simply pushing that data into an array and returning a consolidated view.
00:09:01.760
The other aspect of working with data is ensuring it's normalized for effective visualization.
00:09:08.960
This next section discusses another use case where I previously generated visuals.
00:09:15.760
Here, I'm focused on creating a bar chart as part of the visual representation.
00:09:23.040
I made the bars thin to illustrate the progression over time, keeping the visuals engaging.
00:09:31.280
There’s nothing particularly special about the charting process, but showing this process is vital.
00:09:37.600
I wanted to highlight that this methodology is accessible for creating such outcomes.
00:09:45.760
A challenge I faced was needing to constantly create new endpoints for different visualizations.
00:09:54.080
Eventually, I stumbled upon a library called RubyViz, which ported Protovis to Ruby.
00:10:02.080
This allows generation of SVG server-side, and the syntax is even better in my opinion.
00:10:09.200
The example code from before becomes cleaner and more concise, leveraging Ruby's block syntax.
00:10:16.680
It also produces the same results with much less effort, making the code more readable.
00:10:23.600
The advantage of RubyViz is that you don’t have to create a web service just to render visualizations.
00:10:31.040
You can just call the 2vg method, which allows for the full manipulation of your data before producing SVG output.
00:10:38.480
This creates a flat file with SVG markup that you can access easily.
00:10:46.080
Additionally, once you render the visualization, you don't have to rerun the queries repeatedly.
00:10:55.040
This is significant because it saves resources and time, especially with more complex data.
00:11:01.760
If you want to see the last 20 commits, this example showcases that process.
00:11:10.080
The output shows additions represented in green and red, similar to console outputs.
00:11:16.640
The queries are straightforward; we just access our collection and filter for the recent commits.
00:11:25.920
The scaling helps ensure data isn't too large or small, providing a uniform perspective.
00:11:33.600
The scale can be adjusted to your liking, placing positive and negative values in a graphing context.
00:11:41.760
Here’s a view of the bar styling using Proto, and we leverage that block syntax for neatness.
00:11:49.440
I find the syntax to be practical, leading to cleaner output and improving readability.
00:11:56.800
This outputs directly to a file, generating SVG markup pretty effortlessly.
00:12:03.680
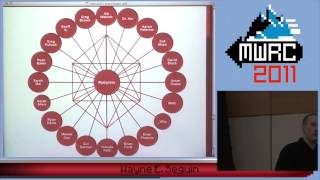
The last visualization was about committers and the amount of code they shifted.
00:12:10.560
Although the labels are a bit janky, it represents the contributions accurately.
00:12:16.640
You can see that Matt's contributions are significant, as indicated by the size of the circles.
00:12:23.680
Visualizing data in this way makes it easier to perceive relationships without clutter.
00:12:31.040
The visualization offers a clear understanding of the differences in commit sizes.
00:12:38.480
This was a fun and engaging way to analyze the Ruby repository and its contributors.
00:12:46.320
To create that visualization, I used MapReduce for more clarity on commit data by author.
00:12:53.920
The MapReduce structure required extracting data efficiently for all commits.
00:13:01.760
The map function provides the author and the reduce function sums the totals.
00:13:08.120
I created an array containing all the nodes for the commits to visualize effectively.
00:13:15.760
This layout helps in providing a visual perspective on the changes over time.
00:13:22.960
The fill and stroke styles make the visualization pop, thanks to Ruby's color libraries.
00:13:30.240
I filtered out a few less notable committers to keep the visualization clear.
00:13:37.600
Lastly, I added labels for each author, representing their contributions neatly.
00:13:44.640
This process demonstrates my love for RubyViz, effectively calling out the 2vg method for a static representation.
00:13:51.520
I can work through the whole visualization talk with confidence.
00:13:59.520
Are there any questions? For example, have you encountered cross-browser issues?
00:14:07.360
I haven’t researched the browser compatibility issues much, but I know there’s a solid site for tracking compatibility.
00:14:14.160
If I were to do this for a job, I'd ensure compatibility. However, this was just a fun endeavor for me.
00:14:21.760
I utilized whatever worked, and Chrome seemed to handle everything fine.
00:14:29.200
I'm planning to put everything on GitHub, and I'd love to chat with anyone interested.
00:14:36.960
Lastly, I got this shirt from doing a visualization for the Milla Foundation.
00:14:43.720
I didn’t win the prize, but I ended up with this quirky t-shirt.
00:14:50.480
I’m eager to continue this visualization work and connect with anyone interested. Thank you, everyone!