00:00:19.810
Alright, so my name is Jason Clark, and I work for New Relic on the Ruby Agent team. If any of you have ever used the New Relic RPM gem, that's the piece of code that I maintain. Today, let's talk a little bit about threads and what we’re going to do with them. This talk isn't purely about concurrency; it’s not just about JRuby and Rubinius, nor about why we care about concurrency and why the Global Interpreter Lock (GIL) makes life difficult.
00:00:36.050
This talk is about how we can use the thread APIs present in the Ruby standard library to gain some extra insight into what our applications are doing. The interesting aspect is that even if your application is not multi-threaded, you can still derive value from these techniques. You don’t need to spawn a bunch of threads to get something useful out of this.
00:00:57.559
So where are we going today? We’re going to discuss how to profile an application. There are a couple of major approaches to gathering data, and we will talk a little about the pros and cons of each. Then, we will look at some code and build a simple profiler ourselves. Lastly, we will focus on how to present that data, as getting meaningful information out of it can be one of the more challenging parts of this process. We will also cover a few gotchas that accompany the techniques that we will demonstrate.
00:01:29.570
Let’s begin by discussing how to profile. There are two major methods we can use to profile an application. The first approach is instrumenting the application. This would involve using tools like SetTraceFunc or RubyProf to wrap virtually every method call made in Ruby. This allows us to capture the exact duration of each call, giving us all sorts of timings and details about what’s happening.
00:01:52.280
So, why don’t we simply instrument everything? Well, not so fast! RubyProf, to its credit, has made significant efforts to optimize this technique, ensuring your app only runs about twice as slow when using it. While this approach is fantastic for development, it is not something you want to run in a production environment with significant traffic.
00:02:10.580
Perhaps there’s another way: we could instrument certain parts of the application some of the time. This approach can actually work in production. If we envision a typical web stack, we can focus on the most important methods and wrap those with timing logic. At New Relic, we implement this in practice, capturing transaction traces to create informative graphs of application performance.
00:02:27.640
However, we must be cautious about what happens within that application code. If we haven’t instrumented a specific method, we won't be able to provide any insights into what’s happening when that method executes. This limitation pushes us to consider a different method for profiling our applications.
00:02:39.710
Instead of instrumenting every method, we can sample. To illustrate how this sampling would work, imagine the same web stack. If we take snapshots over time, we might see a pattern: one moment we're executing a database query, and in the next snapshot, we're hitting a Rails controller. Further snapshots might show the same trend, indicating we’re looping back to the database.
00:03:02.940
This sampling technique doesn't provide exact timing for each call, but it gives a statistical overview of what our application is doing over time without needing to instrument every single method. While we don’t get detailed timings, we can see where most of the time spent is occurring without needing to instrument every single method, which is crucial for high-performance production systems.
00:03:23.430
Now, let’s build a sampling profiler based on this method. Everything we need for building this profiler comes from the Thread class, which is part of Ruby’s core library. Spawning a new thread is straightforward; simply call Thread.new and provide a block of code. This example creates a thread that loops indefinitely. While this specific thread isn’t particularly useful, it demonstrates how you can get that code running.
00:04:01.810
This concept is crucial for our sampling profiler because we won't receive explicit calls from the application we want to profile. Instead, we need a separate thread to run alongside the application to perform sampling at specific intervals. Once we’re in that sampling loop, we can inspect the threads present in our process. Using Thread.list will return a collection of these thread objects and provide information about their states.
00:04:40.830
The output from this list varies dramatically based on your application. For instance, if you're running a local web rack process, you might have three threads, whereas running Puma under JRuby can sometimes show hundreds. Regardless of the environment, you’ll receive a snapshot of what’s happening with those threads. Another important aspect is the backtrace method available on each of these thread objects. This method returns an array of strings showing where in the code the thread is currently executing.
00:05:27.840
This backtrace format may look familiar; it is similar to what you’d see when an application throws an exception, which includes the file, line number, and method being executed. With these components from the Thread class, we are now set to build our profiler.
00:06:04.650
First, we need to create a start method for our profiler class. This method will spawn a separate thread to execute alongside the application, running for a while to take samples. The thread runs asynchronously next to the application code. Within the loop, we check if we should keep running, a decision that can vary based on implementation.
00:06:37.350
One option is to run the profiler indefinitely, or we could configure it to operate for a set timeframe, like 2 to 15 minutes, to snapshot profile data. In our loop, we check whether to continue running and implement a sleep interval to prevent the thread from consuming all CPU resources. For instance, New Relic’s profiler samples around ten times a second, and doing this over a duration of 2 to 15 minutes can yield a valuable picture of the application’s activity.
00:07:25.480
Now, inside the loop, we take samples by capturing the current list of threads and examining how that method works. This part of the profiler becomes complex. When we take a sample, we enumerate the list of threads in the process and step through each one. We need to check if the backtrace is nil, which indicates issues if a thread has finished executing.
00:08:04.600
If the thread is in a dead state, its backtrace will be nil, rather than returning an empty array. Once we obtain the list of backtraces, we can iterate through each line in the array and handle the data appropriately.
00:08:33.050
In this simplified model, we will count how often we see each point in the code. The backtraces will look like a collection of formatted strings representing the points in the code. Each string includes the file, line number, and method we’re currently executing. To track this information, we'll establish a simple hash to serve as a key for each specific code location.
00:09:36.400
This key consists of the file name, line number, and method invoked. For this simple case, we could have used the raw line string, but it’s useful to break it into a more structured format for presentation. We will use regex to extract the relevant pieces and use them as the key in our hash along with an incrementing count to track how often we sample each method.
00:10:06.400
With this, we've gathered all the necessary information to create a presentation from the profiling data. Let’s consider a sample application to illustrate this. On the Ruby Agent team, we refer to a problem as 'trampling,' which happens when someone overwrites a variable value in a multi-threaded context or disrupts another thread’s operation.
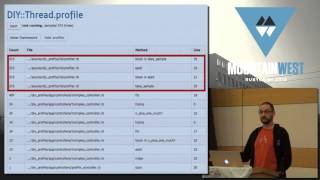
00:10:36.680
I created a simple application to track trampling. When we run our profiler, we can capture output showing the file name, method, and the specific line where activity occurred. This profiling reveals crucial information about the behavior of our application during execution, but sometimes the results aren't what you expect. You might notice more 'noise' than meaningful application code.
00:11:29.000
This noise is understandable; every time we sample the root of our web server, we capture the activity from all layers of our framework. We need to implement a filtering mechanism to display the information more clearly. Once we strip out irrelevant data, we start to see our controller actions and actual application code more distinctly.
00:12:32.830
However, even after filtering, some noise remains. The profiler itself, running in a thread, executes alongside the application, which isn't useful for the profiling output. We should refine our output further to provide a concise view of just the application code that is of interest.
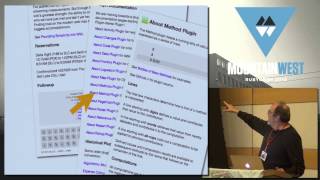
00:13:12.540
An alternative way to visualize profiling data is through a call tree. This hierarchical representation shows the relationships of method calls within the application, which can help clarify complex interactions in the code. By incrementally building this tree from the stack traces we capture during sampling, we can present a more informative view.
00:13:57.640
To construct this tree, we start at the bottom of our stack trace and work upwards. For each unique method encountered, we create a node and increment its count. As we encounter methods that have already been seen, we update their count rather than creating duplicate nodes, which maintains the call tree's structure.
00:15:18.970
Building this tree enables us to visualize not just how often methods are called, but also the hierarchy and relationships between them, which can highlight areas of potential performance improvement. As we discussed, the representation of the information can be approached in various ways, but the call tree gives us a comprehensive view of where the traffic is directed.
00:15:59.290
Let’s talk about some potential gotchas with this approach. One key point is that this sampling process is statistically driven; how frequently you sample and the nature of your app’s traffic are crucial factors. If most of the work your app performs takes only a millisecond, you may struggle to capture that timing in the sampling loop. Conversely, if there’s significant traffic, it becomes easier to capture valuable information.
00:18:02.560
Moreover, this approach presents some multi-threaded issues. I’ve noticed that I/O-based operations may appear more frequently in the profiling data than CPU-bound operations. This observation aligns with the sampling thread, which often runs when waiting for I/O to complete, rather than when CPU-bound operations are fully utilizing resources.
00:18:48.740
Another common inquiry relates to overhead. We extensively tested this feature when deployed with New Relic, recording the polling time for each sample taken. On average, it took about 1.7 milliseconds per sample—acceptable for production environments during short diagnostic sessions. However, bear in mind, the overhead regarding memory consumption due to the data structures holding your profiling data should also be considered, especially if profiling over extended periods.
00:19:37.540
It’s important to note that while you can list threads in Ruby 1.9, the backtrace method is not available in earlier versions, essentially restricting your ability to perform this profiling effectively. In our observations, Ruby 1.9 did show some inconsistencies in backtrace methods; however, this hasn't been a major issue given the various Ruby versions we support.
00:20:34.520
Finally, I want to mention that while JRuby excels in providing real concurrency, some backtrace data can occasionally yield odd results due to Java threads being involved. We've filed issues with the JRuby team, and they’re actively working on these.
00:21:08.380
For further reference, the code for the sample application I discussed is available on GitHub. You can find me as jasonrclark on Twitter and GitHub. Thank you!
00:23:24.210
Member
00:23:35.270
Hmm.