00:00:00.900
Foreign.
00:00:12.420
Good afternoon and welcome! My name is Mike Neville-O'Neill, and I'm a senior product manager at New Relic on the logs team. Today, I'm joined by my co-presenter, Kayla Reopelle, who is a senior software engineer on our open-source agent team, specifically for the Ruby agent. We will be spending some time talking about APM logs in context.
00:00:18.060
Unsurprisingly, before we get into the specifics of the features and functionality that we released earlier this month, I want to give you a brief introduction to New Relic to give you a quick understanding of who we are and what we do. Next, we'll move into how it actually works and the work we did to build the features and functionality that we'll be demonstrating closer to the end of the talk.
00:00:54.239
So, what is New Relic? It makes sense to think about New Relic in terms of the customer problems we try to solve. What you see here today is a software monitoring architecture that is reasonably common. In fact, this is the observability architecture of a customer we worked with before they migrated to New Relic.
00:01:08.159
What we’re looking at here is essentially an explosion in data over the last couple of decades, leading to an explosion in technologies and platforms that developers and engineers are responsible for maintaining and working with. Along with that explosion in data is an explosion of tools that can be used to ingest, manage, and get analytics from that data.
00:01:16.500
As a result, software teams have often been forced to adopt a fragmented monitoring toolset for their infrastructure, applications, logs, digital experience, AIOps, and more. This fragmentation leads to two significant consequences. First, there is no real single source of truth in an environment like this. You have to consult a number of different tools to try to cobble together or synthesize a picture of what's going on.
00:01:40.740
The second consequence is all the time required to synthesize that picture. It’s not easy to do, and there's a lot of friction as you switch contexts from tool to tool to get a comprehensive view of the health and status of an environment. The average organization today has dozens, if not hundreds of disparate tools to monitor different parts of their technology stack.
00:02:02.399
We've heard from our customers, developers, and engineers that they want to centralize their customer and operational data. Hence, we built the New Relic platform. We spent two years working with our customers to understand how we could create a platform where they could centralize that data. What we ended up doing is ingesting all telemetry data into a single open data platform where metrics, events, logs, and traces from any source can be observed, both separately and together.
00:02:34.560
We’ve also baked machine learning into every element of the platform so that teams can detect, understand, and resolve incidents faster, reducing alert fatigue, and allowing for a more proactive and data-driven approach. Lastly, we wanted to allow our customers to easily visualize and troubleshoot their entire software stack in one connected experience, eliminating the need to switch between tools.
00:03:06.120
Now that we’ve explained what New Relic is and our objectives in the observability space, let’s get into APM logs in context. To begin, I want to highlight a specific problem related to logs. While we've covered the broader customer problems, log data presents two key challenges: collection and correlation.
00:03:26.219
How do you get log data out of a source in a given environment into a destination of your choosing, which we hope is New Relic? The second question is: how do you ensure that the data is correlated? How can you ensure that it is meaningful and useful once ingested into a platform, and that it will be available when and where you need it?
00:03:58.380
We approached the entire APM logs in context experience with those two problems in mind. For the correlation piece, we built the logs in context component that connects application logs with transactions. This process is done automatically: we inject span or trace IDs into the logs themselves, so you never have to run a query to find the logs associated with these transactions, spans, or traces.
00:04:28.560
The enrichment capability we added allows logs to be forwarded directly from the APM agent. This means it doesn’t require domain expertise or access to the underlying host to configure a dedicated log forwarder. The individual developer can choose the data they want to send, simplifying their investigations.
00:05:03.600
We’ve also automated the enrichment process, meaning you don't need any configuration to get started. As Kayla will show you shortly, you can set it up and start logging quickly. Moreover, we've enhanced the UI to place log hooks around various elements and features, ensuring that log data is always accessible for investigating a trace or infrastructure issue.
00:05:30.360
At this moment, you can see our supported languages and frameworks, which include Java, .NET, Ruby, and Node. Python, Go, and PHP support will be coming soon. Now, I’d like to turn things over to Kayla, who will walk you through how we built these capabilities and provide a quick product tour.
00:06:14.220
Thank you, Mike. Hello everyone! Let’s discuss how this feature works. I will begin by going over how we run the Ruby agent and instrument new features, followed by a quick demo to see the data in the UI.
00:06:28.680
When we have new code or a new library we want to instrument, we look for a common place where all the events we want to capture will flow through, ensuring that all the necessary attributes and data are accessible. Ideally, this is within the same method, though it may sometimes require a few methods. We're fortunate that the built-in logger class in Ruby is used by many libraries to log messages.
00:06:49.920
Thus, we decided to place our instrumentation code within the Ruby logger class. The logger allows you to define where to output log messages, whether to a file or standard output. You can log by severity, using methods like logger.info, for example. The Rails logger also uses this class, making the interaction consistent.
00:07:29.220
When calling logger.error, it triggers a method that ultimately calls another method named add, passing an error constant as the first argument. We chose not to instrument the add method directly, but rather a different method further down the stack, which formats the message before logging it.
00:08:19.320
The format message method formats the severity of log messages and is instrumental in our logging process. Therefore, we instrumented it because it's called every time a message is logged. This method receives the severity, translated into words, along with the final formatted message, which are the desired attributes we aim to log.
00:09:35.960
Following this, we check if we want the logger to be instrumented and that it is defined. If both conditions are met, we proceed to log a message in the agent log, either using module-prepending or alias method chaining to add the instrumentation code on top of Ruby's method.
00:10:02.040
Next, we'll discuss alias method chaining, an older meta-programming strategy, while module-prepending is the more contemporary approach. When dealing with legacy code, you might encounter alias method chaining frequently.
00:10:36.900
This technique can be thought of as 'undercover work' as it allows us to modify methods without altering their core functionality. We then encapsulate the original logger class method format message as format message without New Relic and wrap our version of the method with our instrumentation code.
00:11:40.560
In this manner, we conditionally instrument log messages while maintaining minimal performance or other impacts from our observation agent. When our log event aggregator records the message, it checks whether the conditions for logging have been met.
00:12:10.920
This includes checking that the message is viable for logging and ensuring it meets our configuration requirements. The logs that you see on the APM summary home page are populated by this record method.
00:12:42.840
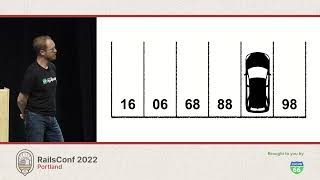
Here, we look for the current transaction, and if it exists, we associate the log event with that transaction. If there's no current transaction, we accumulate it in a separate buffer yet still create the event.
00:13:03.960
To prioritize logs, we align their priority with the transaction's priority. This ensures that if multiple log events occur, those associated with a transaction will be processed first.
00:13:38.040
The event creation involves appending linking metadata, such as the trace ID and span ID, enabling us to associate logs effectively with their respective transactions. The log event format is an array of hashes that gets sent to New Relic for UI decoration.
00:14:28.200
Now let’s take a look at the UI. On this demo account, for instance, we use a Ruby service called Order Composer that collects logs if you've upgraded to version 8.7 of the agent or higher.
00:14:54.840
Upon accessing the APM summary home page, you would typically see a chart representing log metrics categorized by severity level, making it easier to analyze log data at a glance. We also have a triage tab under Logs where all logs for your application are displayed, starting from the most recent.
00:15:44.980
A feature I’m particularly excited about is the 'Ayers inbox'. This enables users to view logs that are associated with a specific stack trace side by side, allowing for better insight into the context of errors raised within a method.
00:16:30.300
We also touched upon distributed tracing, where you can view trace IDs and span IDs related to log events. For instance, navigating to a controller will unveil all the spans occurring during that request alongside the respective logs.
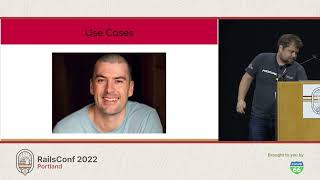
00:17:11.920
Now, let me tell you about a customer who participated in our Early Access Program. The New York Public Library, a pro bono customer at New Relic, integrated their Rails apps with our logger. What they discovered transformed their team’s approach towards logging.
00:17:55.740
They are revamping their logs to enhance their meaningfulness, especially regarding common intermittent errors. For instance, they encountered failed requests for certain services within their microservice structure. However, inconsistencies made it difficult to discern the underlying issues.
00:18:33.780
This led them to add more logging detail for those services experiencing intermittent problems, hoping to resolve these issues and enhance their overall customer experience. Additionally, another customer, Chegg, is leveraging this product in a different manner.
00:19:07.680
Chegg is in the educational services space, providing textbook purchases and rentals. They identified two primary use cases for enhancing their logs: first, to replace existing fluentd sidecars in their serverless environment and subsequently reduce toil and cost.
00:19:39.960
Secondly, they aim to lower their log volume by excluding low-value log data from collection. Thanks to the APM agent's sampling feature, they can prioritize logs tied to transactions, allowing them to effectively manage the volume of logs collected.
00:20:05.880
Thanks, Mike. To wrap up, I’d like to mention future developments for our logging feature, which will largely depend on community feedback. We have already received requests to add custom attributes to log events.
00:20:29.520
For instance, one customer would like to append container IDs to their logs for easy troubleshooting. We also welcome suggestions on filtering options by severity or selective logging, and we would love for you to contribute to the New Relic Ruby agent.
00:20:52.080
Thank you all for attending our talk. I'd like to express my gratitude to Jason Clark, whose wife crafted this beautiful cape ten years ago. He's a major contributor to this feature and helped architect the logs product.
00:21:26.640
I would also like to acknowledge the wonderful audience here, who have supported me throughout my journey as a developer. We are now open for any questions about the features discussed today.
00:23:00.799
If you are on the new consumption model, you pay for users and data ingested. The first 100 gigabytes of data are free, and subsequent usage incurs charges. Thank you for your question and for attending the session today!