00:00:20.480
We're going to start off with Sam Saffron and Jeff Atwood. Jeff Atwood is well known for running the Coding Horror blog. Do people read Jeff's blog at all? Sam and Jeff have been part of a team that put together the new Discourse project aimed at revamping the state of online forums. Why are we still suffering with PHPBB in 2013? They will discuss the work they've done to make that run fast, as it is an application built in Ruby. They've learned a lot during this process.
00:01:59.439
Big welcome to both Sam Saffron and Jeff Atwood! Hi, good morning everyone! This is my first Ruby conference. I know it's a Ruby conference because I saw skateboards, which is awesome. My background—if you don't know—Sam and I worked together on Stack Overflow, starting around 2010. That was a net project and was, of course, closed source. After I left Stack Overflow and Stack Exchange, I wanted to explore a different direction. Fortunately for me, I'm now working together with Sam on the Discourse project. Our team is distributed across France, Canada, and Australia, while I'm in the East Bay.
00:03:37.120
Both teams have their challenges being distributed, although the Stack Overflow team was somewhat less so. It's exciting for me to work on an open-source project because I think this summarizes Discourse very clearly for the audience. We have three main goals with the Discourse project. First, we want people to move away from PHP. I have more to say about that shortly. Second, we want a sane toolchain—one that won't leave you feeling bad about yourself in the morning for using it on a project. Finally, our mission is to transform unhappy forum software into happy forum software. With Stack Overflow and Stack Exchange, we conquered many of the Q&A challenges, but many communities don’t fit into that model and are much more social. Discourse aims to cater to those needs.
00:04:48.400
I wanted to share my thoughts on server performance. I’m really happy to be a part of the Ruby and JavaScript ecosystem. My goal is for people to have a killer app in the form of Discourse—completely free and open-source—that they want to use. Ultimately, I want them to deploy a Ruby toolchain on their servers to achieve this. Additionally, Sam is going to talk about the improvements to the Ruby ecosystem and provide performance feedback to the Ruby community, helping us achieve a well-performing application.
00:06:00.240
This talk is focused entirely on Ruby, but I want to emphasize that you should always look at your front-end performance before becoming too concerned about server-side issues. When Steve Souders was conducting research many years ago, he discovered we often focus on server performance over client performance.
00:06:23.680
Even though this talk is about Ruby, if any of the tools I mention are new to you, I encourage you to take notes and visit websites like WebPageTest, Google Page Speed, or Why Slow. These tools can provide you with essential insights. WebPageTest, for instance, gives you screenshots of how your website renders, allowing you to identify issues with JavaScript placement, compression, or caching that could save you significant time. It’s endemic in our community to overlook these optimizations, even among very large websites.
00:07:45.760
I want to discuss performance optimization and the common misconception that optimizing is pointless. Many believe in premature optimization, but if you explore literature from Donald Knuth, he states that our intuition about performance is often flawed. We need to measure outcomes; without measurement, we can’t make informed decisions. Unfortunately, as of 2013, we often operate blindly—deploying applications to production with little visibility into performance.
00:09:15.120
Let me share a specific issue we faced at Discourse. We encountered a runaway CPU situation where Ruby's CPU usage spiked. Identifying the cause was challenging, and often, you’d revert several commits to find the culprit. PHP has made this worse by complicating the detection process. Thankfully, in Ruby 2.0, we introduced DTrace probes, but be aware that these probes are under a restrictive license that might prevent running them on your server.
00:10:54.000
Running dtrace commands allows you to sample method calls and determine what consumes CPU time. With a consistent sampling strategy, we can discover method bottlenecks and improve efficiency. Another useful tool available on Linux is rbtrace, which attaches to a running process to trace every operation it performs. It's an excellent tool for high-CPU usage applications, giving you XML reports on performance.
00:12:01.800
With rbtrace, you can analyze your application’s performance while it's running. This means gathering statistics on what methods take longer than expected and identifying if changes to the code impact performance. Patch methods in real-time to get specific performance insights instead of making broad changes without data.
00:13:24.760
I would like to now highlight MiniProfiler. This tool provides a breakdown of server processing time when reloading pages. It clearly shows the time taken for various components, including SQL queries, rendering times, etc. This information is crucial because if your breakdown shows significant time spent in SQL, it indicates that the Ruby side of your application may not be the main issue.
00:14:39.920
MiniProfiler also displays client-side rendering times, which show when the user first sees content. Additional features allow for sharing results with your team, making performance discussions easier. After evaluating Ruby's performance issues, the next step is analyzing SQL traces to identify queries that run longer than they should. Furthermore, we need to be aware of issues like N+1 queries, which can be resolved by altering how we query the database.
00:16:06.520
Using tools like MiniProfiler can yield vast insights about our Ruby applications' performance. We can track memory usage and find out which allocations are consuming the most resources. This involves analyzing the retained memory from our code to pinpoint and optimize high-cost operations.
00:17:15.360
The tools I've showcased streamline performance analysis, allowing you to visualize and dissect time spent in various aspects of your application. It can reveal significant patterns that weren’t immediately obvious through testing methods alone. With accurate metrics, developers can revise their code effectively based on strong numerical evidence.
00:18:10.800
Memory profiling in Ruby is now more feasible with the new APIs. You can observe which strings and objects occupy memory steadily without creating excessive garbage. By using memory profiling methods, we can gain momentum in improving Ruby performance overall.
00:19:37.920
Combatting this memory bloat directly contributes to optimizing resource allocation. Our community faces challenges because of how Ruby manages memory, but through effective profiling, we can identify where improvements can be made.
00:20:32.680
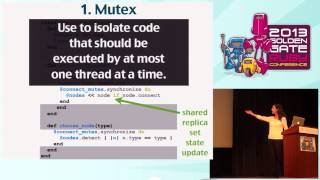
Improving memory usage is a priority for Ruby developers. Requests that retain unnecessary object references or inefficient variable handling can lead to memory leaks and slower performance. The community should address these issues collectively, as this can significantly enhance the overall application behavior.
00:21:57.280
One troubling pattern I’ve encountered in the Ruby community is the practice of requiring libraries in loops. This practice can swiftly degrade performance and lead to unnecessary overhead, and it should be avoided by all means. Measure everything you can, including how and where you require libraries, or any potential exceptions that can occur.
00:23:23.760
We've also introduced some new features that simplify profiling using the Rack framework. Using MiniProfiler, you can granularly identify when exceptions occur across your app, allowing significant improvements to be made. With these tools, we can enhance our understanding of Ruby's performance.
00:24:45.920
In closing, I hope you are motivated to integrate performance measurement tools like MiniProfiler into your workflow. It’s essential to have these tools in place to keep track of application behavior and continuously enhance systems as they develop.
00:26:13.600
By embracing a proactive approach to performance optimization, such as implementing flame graphs to visualize memory and processing patterns, we can better streamline our application architectures. Moving forward, it’s imperative we continue collaborating as a community to improve Ruby performance and create tools that foster visibility into our code's behavior.
00:27:58.480
Thank you for being here, and I’m eager to discuss the many insights from this talk with fellow developers after the session.