00:00:18.539
I hope everyone got their pastries, coffee, and so on this morning. I know this talk is right before lunch, so hopefully I can keep it brief to enable us to eat.
00:00:25.260
However, we have important topics to discuss today. We're talking about merged PRs and how they can serve as an untapped resource for practice and exploration.
00:00:31.679
I actually gave this talk another title: 'Merged PRs: Let's Talk About Debugging.' The goal is to practice debugging and build confidence by diving into the Rails codebase.
00:00:37.440
My hope is that this will help us become better Rails debuggers and developers. That's what I hope we can achieve today.
00:00:43.920
Here's the plan: we're going to start by walking through some theory behind debugging. We’ll explore the role debugging plays in the industry and identify opportunities for improving our debugging competency. After that, we'll look at how using merged PRs can enhance our competency through practice and exploration.
00:00:55.920
Before we jump in, let me share a bit about myself. I work at a company called Zendesk, where I collaborate with thousands of other engineers working in Ruby and Rails.
00:01:03.480
I am part of a core Ruby engineering team, where our job is to manage the use and abuse of Ruby and Rails within Zendesk.
00:01:09.240
I want to clarify that my role is different from that of the Rails core team or the Ruby core team; I am not part of those teams, as my work is specific to Zendesk.
00:01:16.740
One last thing to mention is that I am a community-taught developer and endlessly curious about various aspects of programming, which ties into this talk.
00:01:28.500
We'll begin by discussing the theory behind debugging. What is debugging, and what does it mean in the context of the software industry?
00:01:36.420
The ISO, IEC, and IEEE are three crucial organizations for standards, and they have a joint definition of debugging, which is "to detect, locate, and correct faults in computer software."
00:01:44.720
For our purposes, let's define faults as unexpected behavior exhibited by the software. In this talk, we’ll define debugging as the process of detecting, locating, and correcting unintended behavior in software systems.
00:01:50.580
To understand this better, I'd like to conduct a quick survey. Please raise your hand based on the percentage of your time you believe you spend on debugging tasks.
00:02:03.420
I’m specifically asking about coding time, which is separate from meetings and other activities that also take up our time.
00:02:10.320
Raise your hand if you believe you spend between 0 and 25 percent of your coding time on debugging tasks.
00:02:19.020
Okay, take a look around; it seems there are not many hands raised—perhaps around 20 people.
00:02:26.640
Next, raise your hand if you think you spend between 25 and 50 percent of your coding time debugging.
00:02:35.040
Alright, quite a few more! I'd say it's about one in three or even one in two people.
00:02:41.399
Now, how about those who spend between 50 and 75 percent of their time debugging?
00:02:51.000
Hmm, it looks to be down to just a few people. Lastly, if you spend the majority of your time debugging—75 to 100 percent—please raise your hand.
00:02:57.840
Okay, I see about three hands. It appears the majority fall within the 25 to 50 percent range.
00:03:06.660
Does anyone find that number surprising? Does it seem about what we expected?
00:03:12.660
A few of you seem surprised.
00:03:16.380
If we look back through various studies from the past few decades, we find that the average software developer spends between 35 to 50 percent, and some even upwards of 70 percent, of their time debugging.
00:03:27.180
Researchers have used both qualitative methods, like conducting surveys and interviews, and quantitative methods, such as analyzing IDE analytic data.
00:03:34.260
Broadly speaking, there is consensus that engineers generally spend a majority of their time debug.
00:03:41.220
Not only do engineers spend significant time debugging, but companies also incur substantial costs related to debugging.
00:03:51.540
A 2022 report by the Consortium for Information and Software Quality highlighted that finding and fixing deficiencies makes up the largest single expense element in the software development life cycle.
00:04:03.000
Almost 50 cents out of every dollar is spent on finding and fixing bugs that do not include other costs like damages or reputation loss associated with software bugs.
00:04:10.140
This finding made me wonder about the cost ratio of construction versus correction in other industries.
00:04:16.320
Thinking about it, if 50 cents of every dollar were spent on correction in construction, that would seem highly inefficient.
00:04:23.580
Yet, in software development, we've shifted towards iteration rather than design by committee, a model that various other industries still rely on.
00:04:29.820
It is important to note that the risk profile varies significantly between applications, such as firmware for critical medical devices and regular web applications.
00:04:37.020
What other industries consider rework and waste, we label as debugging and iterating, adopting an agile approach.
00:04:46.140
One of my favorite quotes from the early literature on debugging states that debugging is twice as hard as writing a program in the first place.
00:05:00.000
So if you’re as clever as possible when writing it, how will you ever debug it?
00:05:07.020
Debugging is a costly, yet essential, part of a software developer's experience, which underscores the importance of enhancing our debugging capabilities.
00:05:15.660
Since we dedicate so much time, effort, and resources to debugging, let's explore what it means to be proficient at it.
00:05:23.160
The practice of debugging can vary widely depending on the language, environment, or domain, but a common set of behaviors is exhibited by proficient debuggers.
00:05:35.220
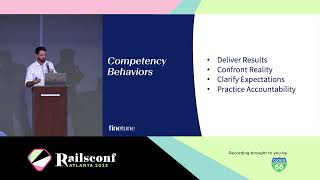
I like to refer to these behaviors as debugging competencies, which include: identifying problems, reproducing issues, applying a systematic approach, comprehending code proficiently, using debugging tools effectively, communicating effectively, and learning from experience.
00:05:42.840
Let’s delve deeper into each of these competencies. The first is identifying problems, which involves recognizing and isolating issues in code based on error messages, unexpected behavior, or user reports.
00:05:51.420
For example, if our app crashes, can we determine the immediate cause by observing its state, reading error messages, analyzing stack traces, or examining crash reports?
00:05:58.320
It's the difference between saying, 'My app is broken' and asserting that 'when I enter text instead of an integer into the input field, an exception is raised due to the input parser.'
00:06:06.840
Next is the ability to reproduce issues, which is essential for understanding their root causes.
00:06:13.740
Once we've identified an error in a specific line of code or application state, we need to reproduce that error in a controlled environment.
00:06:20.820
This allows us to test our hypotheses while controlling other variables.
00:06:28.500
The third competency is applying a systematic approach, employing a structured, methodical process while debugging.
00:06:35.280
One well-cited debugging methodology comes from the book 'Why Programs Fail' by Andrea Leonelli, where he introduces a modified version of the scientific method, known as scientific debugging.
00:06:42.360
The next competency is comprehending code, which involves the ability to quickly read and understand code and develop a strong mental model of the system.
00:06:49.680
Rails conventions aid this process: if we debug an unfamiliar Rails codebase that adheres to Rails conventions, we often progress more quickly than if the app does not utilize those conventions.
00:06:59.640
The fifth competency is the proficient use of debugging tools, which involves effectively applying various techniques during the debugging process.
00:07:06.060
Interestingly, studies suggest that having confidence in just a few basic debugging methodologies like print or puts debugging can often suffice for most problems.
00:07:13.620
User-friendliness or the lack thereof is commonly a barrier preventing developers from adopting more advanced debugging tools.
00:07:20.880
Next, we discuss effective communication, which is about articulating the problem, reproduction steps, and the proposed solution to others.
00:07:27.780
We see this manifest in bug reports, pull request descriptions, and writing tests.
00:07:35.400
The final competency is learning from experience, meaning we continually enhance our debugging skills through past encounters, keeping up to date with best practices, and updating our mental models.
00:07:43.680
This is also evident when we take a localized fix for a bug in our application and submit it upstream, turning a localized solution into a global fix.
00:07:51.000
If we take a step back from the literal definition of debugging, we can see that these competencies also apply to software construction, not just debugging.
00:08:00.180
This is because debugging skills require understanding the code, its structure, and functionality, all of which are essential for software development and general programming.
00:08:06.480
This further emphasizes why debugging matters in our work as developers, and it’s why I am so excited about debugging education.
00:08:13.920
Not only is debugging costly in terms of time, effort, and money, but improving as debuggers means improving as developers.
00:08:21.960
This raises a profound question: how do developers become better debuggers?
00:08:29.760
The short answer is often by accident; most developers do not intentionally learn or train debugging skills as they do with algorithms or design patterns.
00:08:37.740
Instead, they learn through trial and error, community resources, or through informal mentorship.
00:08:44.520
This phenomenon has been the subject of research since the 1970s, indicating a long-standing gap in debugging education.
00:08:52.560
Numerous papers urge the inclusion of debugging course material in university curricula or advocate for structured learning around debugging.
00:09:00.700
However, a field study conducted as recently as 2017 revealed that many developers attribute their debugging knowledge to self-education and information gathered from the internet.
00:09:08.880
Those who did report some form of debugging education did not respond significantly differently to debugger-related questions.
00:09:15.960
On the surface, this indicates a potential problem: debugging is a crucial skill in our industry, yet it is rarely formally taught.
00:09:23.160
I propose that it isn’t more formal education we need, but rather better—if not just more—intentional practice and mentorship that provides real-world hands-on debugging experience.
00:09:30.960
To recap why developing competence in debugging is essential, consider this: debugging takes significant time.
00:09:37.020
Many of us invest a considerable portion of our time, effort, and budget on debugging, rather than on creating the code.
00:09:43.380
Furthermore, debugging incurs high costs—finding and fixing bugs is the single largest expense in the software development life cycle.
00:09:51.360
Becoming better at debugging correlates directly to improved programming competency.
00:09:58.380
Yet, I couldn’t emphasize enough how debugging is not formally taught, leaving many of us without education in this crucial area.
00:10:06.660
I’m excited that the Ruby and Rails communities have an opportunity to lead the industry with our debugging expertise, just as we have with our mastery in testing.
00:10:13.680
Now, let’s take this overarching idea and examine how it operates in practice.
00:10:20.700
This brings us to the next section: strengthening core competencies through insights from the community.
00:10:27.540
In order to add intention to our debugging practices, I'm proposing to you an exercise that utilizes merged PRs for practice and exploration.
00:10:36.360
Utilizing merged PRs for debugging practice allows us to receive immediate feedback in a low-stakes environment.
00:10:44.880
These real-world examples from the Rails codebase encourage a deeper examination of the framework than we might ordinarily undertake.
00:10:51.480
What makes this resource extremely valuable is that it already exists, and there’s no cost involved in leveraging what is already available.
00:10:57.480
The artifacts from development left behind can be utilized for either self-directed study or through guided mentorship.
00:11:05.640
Here’s how the exercise works: we start by setting up our development environment.
00:11:13.320
Then, we find a suitable candidate PR, ideally one that's a bug fix and has a clear description of the bug, with a relatively small number of lines changed.
00:11:23.040
A key aspect of this exercise is to not read the code of the PR initially—we want to begin with the description of the bug in mind.
00:11:30.720
This way, we can put our debugging skills into practice without being influenced by what we already know worked.
00:11:37.680
Next, we embark on the actual debugging process, using techniques ranging from puts and breakpoints to benchmarking and tests.
00:11:44.640
Finally, once we feel we have a solution or if we get stuck (and that’s perfectly okay), only then do we examine the patch and the code.
00:11:50.880
We then compare our solution to what was ultimately merged.
00:11:58.740
Let’s go through these steps in further detail. First, setting up our lab.
00:12:07.500
I’ll cover this section fairly quickly, assuming that most of us have our Ruby and Rails development environments set up.
00:12:14.700
Even if it might not be configured to work on the actual Rails framework, I trust we have Ruby installed and familiarized.
00:12:22.620
Also, setting up your development environment for this exercise mirrors setting up your environment for Rails.
00:12:29.820
This process is documented in the contribution guides within the Rails guide, so certainly check those out.
00:12:38.340
On a high level, there are two approaches for setting up the environment for this exercise.
00:12:45.060
In both scenarios, the first step is to fork Rails.
00:12:52.740
If you've yet to fork Rails, go ahead and click 'Fork' on GitHub to have the code available.
00:12:59.640
After forking, you have two potential approaches: you can clone the code locally and build a new Rails app using the 'dev' flag.
00:13:05.520
I will clarify what that is if you're not familiar. Alternatively, you can use GitHub Codespaces to write and run tests and utilize bug report templates.
00:13:13.980
Both of these approaches are covered in the Rails guides.
00:13:23.160
Since we’re practicing using bugs that are already fixed in main, we should ensure that we are working with the code as it existed before the PR was merged.
00:13:30.540
We accomplish this by using the SHA of the merge commit, which can be found at the bottom of the pull request once it has been merged.
00:13:38.400
We want to branch off of that merge commit's parent by using the caret symbol at the end of the SHA.
00:13:46.920
Once we branch off the parent commit, we have the code as it existed prior to the fix being merged.
00:13:54.750
To build an application from this code, we run 'bundle install' and then 'rails new' along with the dev flag.
00:14:02.970
This command will update our Gemfile by adding the path option to the Rails gem declaration, pointing to the current directory.
00:14:11.520
Thus, we want to run 'rails new' with the dev flag within the Rails directory where we cloned our fork.
00:14:19.260
After everything finishes installing and bundling, we will have an empty app as it existed when it was before the bug was fixed.
00:14:27.960
Now, we can build a Rails app like we typically would and start replicating the bug by constructing parts of the application relevant to the issue.
00:14:36.240
Another option is to use GitHub Codespaces, which allows us to develop directly in the browser or through VS Code.
00:14:43.380
This method enables us to run Rails tests seamlessly while avoiding managing all the Rails dependencies or utilizing VirtualBox.
00:14:50.520
To create a GitHub Codespace, go to github.com/codespaces, click on 'Create New Codespace,' and follow the instructions.
00:14:58.620
You will have a VS Code instance initialized directly in your browser.
00:15:06.680
If you prefer working locally, you can use the Remote Explorer extension developed by GitHub.
00:15:13.920
Regardless of the approach taken, once you have the codespace, check out the parent commit of the merge commit as we did previously.
00:15:20.580
Next, run 'bundle install,' just like we did in the previous steps. Then, we're ready to run our tests and explore.
00:15:28.920
Once our environment has been set up, we now need to find a candidate PR that we wish to use for our debugging practice.
00:15:35.310
I will admit, I found this aspect daunting at first with the sheer number of PRs available.
00:15:42.840
It felt overwhelming, as I thought it would be difficult to understand what was going on with any given PR.
00:15:50.850
Nevertheless, I discovered a few strategies for identifying well-scoped PRs that are isolated enough for practice.
00:15:58.230
First, ensure we are searching for bug fixes; luckily, not all code that goes into Rails is a bug fix; we also have new features and documentation updates.
00:16:05.220
As the Rails repository does not label bug fix PRs, we’ll need to perform a text search for terms like 'fix,' 'bug fix,' or 'regression.'
00:16:13.080
Moreover, examining linked issues is beneficial, as I find it helpful to consider the original issue the PR author addressed.
00:16:20.520
Similarly, while there’s no explicit filter for linked issues in PRs, they can be easily identified in the UI.
00:16:28.320
Next, consider focusing on particular components; each of the 12 Rails components comes with a corresponding label in the repository.
00:16:35.400
If there’s a component you're particularly interested in or one you wish to explore, you can filter PRs specifically for that component.
00:16:43.140
Next, it’s best to narrow down to PRs that involve a relatively small number of changes—around a hundred lines changed seems reasonable.
00:16:51.000
Smaller modifications generally tend to correspond to lower complexity, making practice easier.
00:16:57.720
While we can’t filter in the UI for this, the GitHub API might offer better options; I just haven’t explored that yet.
00:17:05.520
Also, consider the discussions section of the PR; numerous comments can provide insights, but PRs with a lot of discussions often indicate controversy or a need for rework.
00:17:12.780
Therefore, while engaging and informative, PRs with more limited discussions tend to be more suitable for practice.
00:17:20.460
Finally, we only want to consider PRs that have been merged, not simply closed.
00:17:27.780
The default filter in the UI shows both open and closed PRs, but importantly, the closed filter also includes merged PRs.
00:17:36.060
So, be sure to check that we’re specifically looking at merged PRs to practice with.
00:17:44.220
Admittedly, the process of finding suitable PRs is somewhat manual, but it is not without benefits.
00:17:54.060
We are compelled to read numerous PRs, which is rarely a waste of time; examining merged PRs can always offer insights.
00:18:00.900
With that said, I plan to share a comprehensive list of PRs that I’ve found to be good candidates, as well as the slides for this talk after the conference.
00:18:06.600
So keep an eye out for those resources if you’re not too thrilled at the thought of combing through numerous PRs.
00:18:14.520
Quickly, I want to share three PRs that I believe serve as excellent examples.
00:18:20.520
The first one is 'Fix Auto Increment on Primary Key for MySQL.' This PR has limited conversation, a clear problem description, just 11 lines changed, and it was recently merged.
00:18:27.240
I find value in working on PRs that have been merged recently because they often reflect code that is more relevant to our work.
00:18:35.880
The next PR is 'Fix Add Foreign Key with If Not Exists Referencing the Same Table via Different Columns.' This PR also has minimal conversation but a clear description and only 11 lines changed.
00:18:43.920
Moreover, it features a well-documented linked issue, which is helpful for understanding the context of the bug.
00:18:50.220
Finally, I wish to share a PR titled 'Add Support for Unique Constraints in PostgreSQL!' This one has substantial conversation, indicating an extensive discussion.
00:18:58.920
While it contains 531 lines changed and provides a thorough description, I do believe this larger PR may involve too much work for this type of exercise.
00:19:05.580
I envision this exercise as something akin to completing a crossword puzzle—not a task that should resemble a week’s work.
00:19:13.140
Now that our environment is set up and we’ve selected a PR to practice with, it’s time to get down to debugging.
00:19:20.400
The next section will be a lightning round of debugging tools and techniques I have been currently practicing.
00:19:28.620
This isn't an exhaustive list, but I want to provide a high-level catalog to showcase the variety we can work with.
00:19:36.420
As a quick note, I will ask for audience participation at the end of this list—if you have a tool or technique you find intriguing, I’d love for you to share it.
00:19:43.740
So, let’s get started! First up is the ever-popular puts debugging, which is widely used and often sufficient for solving issues.
00:19:51.420
If you stop here, you likely are still quite effective debugging your code.
00:19:59.520
Rails also features a built-in logger, which allows for log level adjustments, adding custom log messages, and specifying the destination for logs.
00:20:06.680
When debugging, we often log to standard output, yet there are instances when logs not going to standard output are essential.
00:20:14.040
Next, I've mentioned scientific debugging, based on Andrea Sella's methodology from his book 'How Programs Fail.'
00:20:22.320
This involves observing failures, inventing hypotheses, making predictions, testing experimentally, and repeating until we resolve the defect.
00:20:30.060
He also advocates maintaining a debugging journal.
00:20:36.600
Desk checking is another technique, which essentially means reading both the code and documentation.
00:20:43.560
Tests can also aid in debugging, as they are helpful not only for regression testing but also for validating that a bug is fixed.
00:20:50.610
You may not run all the Rails tests, but there are methods to run specific files or tests covered in the Rails guides.
00:20:58.920
Using bug report and benchmark templates from the Rails codebase is another beneficial technique.
00:21:05.370
These templates are designed to help quickly reproduce issues with minimal dependencies.
00:21:13.920
They are particularly useful when submitting a bug report or validating a bug during debugging.
00:21:21.060
The Benchmarks template is valuable as it allows us to analyze code performance and check for any regressions.
00:21:30.300
Next up is Ruby Debug, or rdbg, which is the default library for interactive debugging, enabling us to set breakpoints and navigate through our code.
00:21:39.240
Pry and Byebug offer similar features; also, rdbg has a VS Code extension that utilizes remote debugging.
00:21:46.560
A notable blog post by Justin Searles explains how to set this up with the debugging UI integrated into VS Code for Ruby and Rails.
00:21:54.090
The web console, built into Rails, lets us execute arbitrary Ruby code directly in the browser, given our application’s state.
00:22:02.160
To use it, simply install the web console gem.
00:22:10.710
Another nifty tool is 'Bundle Open,' which allows for opening the source code of a gem without cloning it.
00:22:17.160
You can edit the code in your default editor, set breakpoints, and make changes just like with your application code.
00:22:24.900
There’s also the 'git bisect' tool, which allows you to navigate through Git history to find the specific commit where a certain bug surfaced.
00:22:32.280
Source location and Kernel caller methods help efficiently understand where the method is executed and what the current stack trace looks like.
00:22:42.780
These tools assist you in pinpointing where the code is executed from and where it is defined.
00:22:52.080
We also have Parser and Ripper, which will help you interact with the abstract syntax tree of Ruby.
00:22:59.220
Note that this can be beneficial for implementing code tools, as well as any kind of automation.
00:23:05.640
Now, onto a little audience participation—does anyone have a tool or technique they want to share that I may not have covered yet?
00:23:13.560
For example, Flame Graphs?
00:23:22.380
These graphs visualize the execution stack and show where the time is being spent in your code.
00:23:29.040
Does anyone else have a suggestion? Right here?
00:23:36.060
Yes, Pry rescue! Great!
00:23:43.560
There are also tools like App Map and Stack Profiler.
00:23:51.100
The hallway track is a great place to share additional tools and experiences.
00:23:56.780
I want to emphasize that there are countless tools and resources out there, and during work, it's often the last time we try something new.
00:24:03.740
That’s why I believe these exercises are ideal for experimenting with new tools that one might not typically use.
00:24:10.540
Now, let’s cover the final section: evaluating your solution.
00:24:17.880
Once you’ve set up your environment and approached the debugging process, how do you proceed?
00:24:25.380
You can evaluate your code much like you would with a pull request. While we certainly want our code to work, this exercise focuses on enhancing debugging competencies.
00:24:33.180
I encourage you to reflect on what you learned during the debugging process and ensure you have fun.
00:24:42.420
This exercise is low-stakes and centered around learning and growth—there's always an intangible takeaway when I engage in this exercise.
00:24:49.740
It doesn’t feel necessary to conduct a formal code review—instead, it’s about exploration.
00:24:56.880
As we draw to a close, I want to mention three quick points.
00:25:03.360
First, I have not contributed to Rails; I'm just an observer at this stage, exploring the available artifacts.
00:25:12.300
My passion lies in education and growth, and I definitely aim to contribute to Rails in the future.
00:25:18.540
But for now, I’m focused on growing my understanding, which feels beneficial.
00:25:27.420
Secondly, it’s critical to remember that analyzing someone else’s past work should not be an opportunity to criticize retrospectives.
00:25:35.040
They are delivering the code while we’re pretending to be in their shoes, so practicing empathy during reviews is essential.
00:25:42.900
We began by discussing debugging theory and its significance in the software industry, including the costs associated with time, effort, and money.
00:25:52.200
We defined key competencies and realized the lack of formal education, allowing us to establish competencies that guide our growth, both personally and for others.
00:26:01.860
Lastly, we used the exercise of setting up our environment, finding merged PRs, conducting the debugging work, and evaluating our solutions.
00:26:09.069
This is the exercise: rewind time and debug Rails with many tools at your disposal, employing this self-directed exercise to explore and become familiar with Rails.
00:26:17.320
You can do this in a low-stakes environment, where you are not responsible for delivering on a deadline.
00:26:23.069
Thank you, everyone!


