00:00:00.900
Welcome to Rails C! Today, we're going to learn how to turbocharge our use of the interactive console.
00:00:12.420
Good morning, everyone! I'm excited to be here with all of you.
00:00:15.960
Thank you for the warm welcome. My name is Sweta Sanghavi, and I'm a senior developer at BackerKit.
00:00:21.840
At BackerKit, we build software that helps crowdfunding creators to build community and fulfill their projects. If you've backed a project, you might have received a survey from us.
00:00:32.940
I began my journey with Rails after a previous career as a life science consultant. In my early stages of learning Rails, I came to really love the console. My goal today is to inspire you to appreciate this tool that we all have at our fingertips.
00:00:50.280
The console provided an easy way for me to get to know the Rails environment and deepen my understanding of Ruby. Today, we'll start by taking a deep dive into the console and checking under the hood to see what enables us to use the features that we depend on.
00:01:02.100
We will explore how to store context, evaluate Ruby, and engage with the interactivity we've come to expect. Then, we'll discuss tactics to supercharge your usage of this tool to become an even more effective developer.
00:01:14.220
So, what is Rails console? The console command gives us a way to interact with our Rails application from the command line. It provides access to the data underneath our application, allowing us to make changes without loading the web UI.
00:01:30.120
With the console, we can use gems and libraries to facilitate data retrieval, such as Active Record. This way, we can run queries and understand the state of users or other objects in our application.
00:01:50.040
We're even able to define and execute Ruby code right in the console. The console allows us to evaluate a piece of code in a specific context, enabling us to focus on a method or class we want to learn more about.
00:02:06.480
It requires very little setup; you can use it right out of the box. Moreover, the context is configurable—you can define classes, methods, variables, and other elements to aid your exploration of the application.
00:02:19.440
The console provides quick feedback about Rails functionality, allowing us to see human-readable errors when something goes wrong. Today, our goal is to use the console to learn more about its capabilities.
00:02:36.600
How is it able to do all these great things? Rails console actually uses the Interactive Ruby Shell (IRB) behind the scenes. When I first started learning Ruby, I used the IRB console to interact with Ruby code.
00:02:51.180
Similarly, our console utilizes IRB, which provides access to all the core Ruby libraries. It's fast and useful for interactions that primarily involve Ruby.
00:03:11.640
Additionally, you have the option to import other Ruby libraries into your IRB session by installing a gem and requiring it, or simply requiring any other Ruby libraries you've defined.
00:03:30.360
However, you may not always want to install every gem included in your Rails application, or keep track of versioning. That's where Bundler comes in. You can call 'bundle console' to spin up a console that has access to both the core Ruby libraries and the gem code at the versions specified in your Gemfile.
00:03:54.020
When you want access to your entire Rails application, you can spin up the Rails console, providing access to a complete Rails environment, including auto-loading and initialization of the application—all the features you expect.
00:04:17.680
Let's discuss some of the features that make the console so effective, starting with storing context. If you call a method or variable that the console doesn't recognize, it will typically raise an error, such as an undefined local variable or method error. However, we can actually store context within our session.
00:04:30.780
By defining a method, such as 'full_name', we can access that method when we call it. The IRB uses sub-sessions to save and differentiate context effectively.
00:04:50.400
When you spin up a console, you start in a sub-session in the context of an object called 'main.irb'. This context is indicated by 'main' in parentheses. Anything executed in this console runs in that main context.
00:05:02.460
Let's play with how sub-sessions work to gain a better understanding of storing context. By using the command 'IRB', we can start a new sub-session. You may notice a number indicating that you're now in a new sub-session.
00:05:19.920
Using the 'jobs' command, you can output the sub-sessions in your current IRB session, showing both the original session and the new sub-session.
00:05:38.820
Let's check what's shared and not shared between these two sub-sessions. By switching back to the initial sub-session and setting a variable, 'display_name', we can check its value in the new sub-session.
00:05:53.760
When we try to call 'display_name' in the new session, we find that we no longer have access to that variable. Interestingly, however, we can still call the method 'full_name' that we defined in the original session.
00:06:09.780
So, how is this possible? Another important aspect to consider is the concept of a workspace, which keeps track of sub-sessions. Each sub-session maintains its context, while workspaces represent the top level containing those sub-sessions.
00:06:30.660
The context keeps track of the execution state at any given point within our program. This leads us to an important topic: instance variables, instance methods, and the concept of 'self'.
00:06:44.280
Together, these contribute to what we refer to as the execution context. In Ruby, access to context is facilitated through the Binding object. This built-in Ruby class can encapsulate the context at your current scope.
00:06:57.380
The Binding object can be passed around as an argument, allowing us to evaluate code in a specific context.
00:07:06.779
Next, let's explore the console's ability to parse Ruby code. Through our earlier example of 'full_name', we see that we're able to evaluate Ruby code within the console.
00:07:18.660
The console needs to parse and evaluate this code, but how does that happen? I want to take a moment to discuss Abstract Syntax Trees (ASTs). An AST is a low-level representation of a program's structure.
00:07:31.020
A parser can transform Ruby code into an AST, allowing for easier compilation and translation between languages. In Ruby, we have a library called Ripper that provides insight into how Ruby handles parsing.
00:07:48.779
Ripper can output the tree that Ruby uses to parse the code, giving us an interface to explore its inner workings.
00:08:02.400
Using Ripper, we can request different types of trees, and since we have access to core Ruby in our console, we can explore various nodes and their structures.
00:08:17.460
For instance, we can use the 's(:method_name)' method to output a symbolic expression tree. Let's evaluate the output for a method definition, such as 'full_name'.
00:08:32.160
When we call this method with our method definition, we see a structured representation of our code—a symbolic expression organized in an array format.
00:08:49.559
Step by step, we can analyze the components. Initially, we observe the symbol 'program' alongside the keyword 'def', signifying the start of a new method definition.
00:09:05.640
Next, we introduce the variable 'ident', which refers to the identifier for our method 'full_name'. Following this, we see parameter representation, defining 'first_name' and 'last_name'.
00:09:21.660
Lastly, we reach the body of the method, as indicated by the body statement. Within this segment, we can identify local variables represented by 'VAR ref' of 'first_name' and 'last_name'.
00:09:39.180
Although not every element of Ripper's output may be immediately clear, it serves as a valuable tool for understanding how Ruby parses and processes code.
00:09:55.740
You can experiment with Ripper in your own console as well. I encourage you to evaluate some code and take a look!
00:10:08.580
Another feature worth discussing is the interactivity of the console, made possible by the readline GitHub integration.
00:10:20.280
We are all accustomed to using the console in a text-editor-like format, benefiting from features like indenting and syntax highlighting.
00:10:34.200
Hit Ctrl+A or Ctrl+E to navigate through a line. Many of these commands come from a source library named 'newreadline', which provides inline editing and history capabilities.
00:10:50.879
Originally released in 1989, this library allows for improved interaction with various shells. In Ruby, there's a line editor called Readline that further extends this functionality.
00:11:01.920
This Ruby Readline provides features like auto-completion and history access when entering commands, facilitating a better console experience.
00:11:12.300
Since then, some of the limitations of the Readline library prompted the creation of 'reline', a pure Ruby implementation that supports multi-line editing commands.
00:11:24.660
This change sparked a fascinating evolution of software libraries and tools as we've integrated them into our day-to-day development work.
00:11:37.440
Are we ready to turbocharge our use of the console? In this section, I'll share how to use the console to enhance your development skills and efficiency.
00:11:51.960
We can leverage console features for performance improvements, debugging, and enhancing our day-to-day product development.
00:12:06.660
First, let's discuss performance. Tools like New Relic can provide transaction traces for pages that take too long to load. However, after receiving this feedback, additional debugging is often necessary to identify the changes needed to improve load time.
00:12:24.360
The console excels in helping you pinpoint performance issues in your code. ActiveRecord and scopes may abstract complexity, making it harder to see performance culprits like inefficient queries.
00:12:45.960
Using the Benchmark library in the console can help you measure the execution time of specific methods. The measure method from Benchmark outputs how long it took to execute your code in seconds.
00:13:03.600
Once you isolate a problematic segment of code, try commenting it out to observe whether your page load times improve as expected.
00:13:23.280
You can also run 'to_sql' on any ActiveRecord query to reveal the underlying SQL code. This allows a quick check to ensure your query is performing as intended.
00:13:39.759
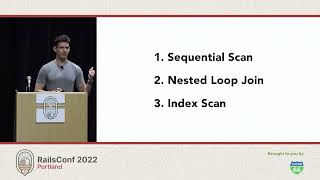
Additionally, the 'explain' method can be invaluable for performance debugging. When executed on an ActiveRecord query, it triggers the query and outputs a query plan, detailing the method's execution.
00:13:58.920
The structure of the query plan reveals necessary scans, which can help decide if adding an index could improve performance.
00:14:18.720
In some cases, closely mimicking production behavior may require accessing the production console. This unique interface allows you to gather precise data and context to understand performance in users' environments.
00:14:38.880
When using the production console, exercise caution, as changes made here will affect live production data. However, it provides an opportunity to run benchmarks or troubleshoot issues directly.
00:14:56.100
To mitigate mistakes, consider using 'sandbox mode', which rolls back any changes made during the session. This provides a safety net for testing without risk.
00:15:09.479
When speeding through a console session, you can clear the console with 'Command K' to focus on specific actions without scrolling through old logs.
00:15:28.920
Additionally, remember that console sessions don't automatically reload code changes from your application. Use the 'reload' command to refresh your context before testing.
00:15:47.640
If you've ever lost track of variables, the underscore (_) variable captures the last result of an expression. Utilizing this can save time by allowing quick access to previously executed expressions.
00:16:03.720
For quick command retrieval, use Ctrl + R, which initiates reverse command search. Typing in a previously run command lets you rerun it without retyping the entire command.
00:16:18.960
I compiled a cheat sheet of useful commands for quicker reference that may assist you during your development process.
00:16:36.600
Lastly, I would like to express gratitude to BackerKit for their support in my journey to speak at conferences, and at the same time, an acknowledgment to wnbrb for their role in fostering a strong community for women and non-binary Rubyists.
00:17:09.960
Thank you everyone for attending today's session on turbocharging your Rails console usage. If there's anything from this talk that resonates with you, or if you try implementing something you've learned today, please let me know. I'd love to hear your feedback!
00:17:31.260
Here's my email and my handle.
00:17:33.360
I hope you have a fantastic day!


