00:00:19.000
Thank you all for showing up for my talk! I'm really excited about this, and I hope you'll find it interesting and learn something new from it.
00:00:26.160
A little bit about me: my name is Rishi Jain, and I've come all the way from Bangalore, India. I'm fairly active on Twitter, and you can connect with me there. I work at Ulabs as a senior software engineer.
00:00:37.559
Ulabs is a remote-first company based out of Philadelphia. A few things that stand out about Ulabs as an employee are how smart and empathetic my colleagues are, how friendly they are, and how transparent the work culture is.
00:00:51.680
It’s a very diverse group of people coming from various backgrounds and countries. So, what do we do at Ulabs? Well, here’s a nice summary of what we offer at Ulabs. If you're interested in any of our services, feel free to reach out to us on Twitter or on our website, and I'll connect you with the right folks.
00:01:12.680
One of our offerings is Tune Reports for Ruby applications. We've partnered with Nate Bache to work on these Tune Reports. Some of the information I'm going to share today is also from my experience doing Tune Reports for clients. I don't think Nate is in the audience, but that's okay. I was hoping he could handle all the hard questions!
00:01:38.040
Moving on, we give back to the community in several ways, such as writing blogs, and you can read our blogs on different topics at the link mentioned above. We also maintain a few open-source gems, and you can check them out as well. I'm going to share this presentation later on Twitter and in the Slack channel, so you'll have access to it.
00:01:54.960
RailsConf is very special for me for two reasons. First, I've wanted to be a part of this conference for a long time, and it didn't happen until this year. The second reason actually requires a small story. Back in 2019, I was speaking at RubyConf India, and my parents attended my talk.
00:02:18.879
Then, last year, my wife attended my talk at RubyConf India again, and she met all my friends from the community. It was a fun experience. During that stage, I joked about who from my family would attend my talk next, and it happens that this time, my sister is here attending my talk from Chicago.
00:02:47.840
This makes the conference even more special for me. During the course of this talk, if at any time you feel overwhelmed or lost, I want to remind you that I've learned this stuff over time. I wanted to give this talk specifically for junior developers because I did not know most of these things when I was a junior developer.
00:03:07.799
I learned many things pretty late in my journey, so I hope this talk will help you learn these concepts earlier in your journeys than I did.
00:03:18.599
Let's get started with the reason why we are all here. Let's do a quick poll with a show of hands. Raise your hands if you've encountered an N+1 query in your code base.
00:03:25.120
All right, I see a lot of hands! Now raise your hands if you’ve heard from your customers that the app has been running slow for the past few days. I see a few hands there. Lastly, how many of you have heard from your senior engineers or your DevOps team that the CPU utilization is very high or that the app consumes a lot of memory?
00:03:45.920
Have you deployed something new, or do you know why these issues could be happening? A few hands there. Awesome. Well, congratulations! You've heard or been around things related to Rails performance monitoring.
00:04:02.120
However, there are many misconceptions about Rails performance, and let's address them today. First misconception: it is often assumed that performance improvement and monitoring is solely a concern for senior developers on the team.
00:04:19.840
As junior developers, we're expected to build the features assigned to us, and any issues found in the code should be caught during code reviews by senior devs. However, I believe this should not be the case. First, as developers, we should understand the impact of the code we write from a performance perspective.
00:04:40.639
Second, not everything can be caught in code reviews by senior developers—things will slip through. So it is our duty as junior developers to be more careful about what we write.
00:04:58.600
During this talk, we will see how junior developers can identify these performance issues and help fix them or at least be more aware of their code's impact on performance.
00:05:12.480
Next misconception: the backend front-end fiasco. Sometimes engineers writing the backend code assume their code works perfectly and is fast.
00:05:35.280
They believe the issues of rendering fall solely under the frontend team's bucket. After all, we are executing SQL queries and serializing the data, so it has to be fast.
00:05:43.919
Meanwhile, the frontend team claims they're just rendering whatever data the backend team sends, arguing it’s their APIs that are slow. They need to check their backend logs and investigate what's making their API slow.
00:06:03.959
A common mantra in response to slow performance is: let's cache it. A classic mistake people make is assuming that anything that is slow can be made fast through caching.
00:06:24.160
However, this isn't necessarily true. In fact, caching can sometimes worsen the performance. For example, the data you're caching could be changing too often, requiring frequent cache invalidation, which leads to stale data being displayed.
00:06:50.359
You might end up performing more network requests than if you weren't using caching at all.
00:07:06.959
Another common misconception is that bigger hardware or more hardware will make your app faster. Think of it this way: bigger highways do not make cars faster; they only accommodate more cars.
00:07:30.079
Yes, it allows for more requests in our scenario, but it doesn’t make those requests faster. Now that we've seen some misconceptions, let's explore why you should care about Rails performance monitoring.
00:08:00.680
I'll give you four reasons: scalability, user experience, cost savings, and professional growth.
00:08:27.360
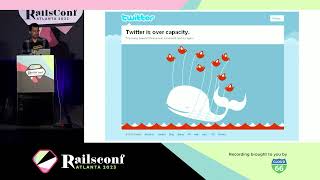
Let's delve into each of them. Scalability: imagine your app has gone viral, and you're seeing a sudden influx of users. As junior developers, you can proactively keep an eye on performance and address any issues to ensure the app performs well under increased traffic.
00:08:50.559
User experience is crucial. If your sales team is pitching your product alongside competitors with similar offerings, user experience becomes the deciding factor. Does your app respond within 300 milliseconds, or does it take 5 seconds to complete a transaction? Guess which one the client would prefer.
00:09:07.000
If a web app is slow and unresponsive, users are likely to become frustrated and abandon it. By focusing on app performance, junior developers can help ensure a positive user experience.
00:09:26.200
Cost savings are another consideration. If customers are complaining about slow response times, the immediate thought might be to add more servers to handle the requests. However, the issue might be due to increased request queuing time.
00:09:45.920
Throwing money at the problem without understanding the root cause can work in the short term but will likely lead to the same problem recurring in the future.
00:10:07.680
Professional growth is also a critical aspect. As an engineer, understanding the implications of your code in terms of user experience, cost to the company, and resource consumption is crucial.
00:10:26.639
For example, understanding what kind of code can lead to memory leaks is essential. Until we make the effort to grasp the impact of our code, we can't truly own it, which can lead to better job satisfaction, higher salaries, and career advancement.
00:10:49.600
Now that we've discussed why Rails performance monitoring is important, let's break down the app into different components. In a typical system, you'll have a frontend, a backend, a database, and API capacity.
00:11:15.560
When we talk about backend performance, the most important thing to know about is APM tools. Application Performance Monitoring (APM) is the process of using software and telemetry data to monitor the performance of business-critical applications.
00:11:38.040
Let’s look at some APM tools available, such as New Relic, DataDog, Scout APM, and many more. These are not listed in any specific order; they simply come to mind. These tools can seem intimidating at first.
00:11:54.399
I remember feeling lost when I first logged into one of them; there were so many options, and I didn't know where to start. So I want to give you a brief overview of what these tools can do for you to make it easier to get started.
00:12:14.960
These tools provide various metrics, including request queue times, response times, top transactions, and more. They furnish insights about how your app performs resource-wise, utilization-wise, and user experience-wise.
00:12:37.440
Request queuing is one of my personal favorites. It measures how long your request must wait before being processed by the app server. A good request queue time should be between 20 to 50 milliseconds; anything over that indicates something is wrong and customers are not having the best experience.
00:12:56.480
For example, let's look at a graph showing a spike in request queue times up to 10,000 milliseconds—that is 10 seconds! Obviously, a user would become frustrated if nothing happens for that long.
00:13:20.079
The simple reason for this spike is that all existing servers are busy processing other requests. Your request has to wait until a server becomes available to handle it, which is directly related to resource allocation.
00:13:42.960
If the request queue time is consistently under 20 milliseconds, it may indicate that you are over-provisioning resources. APMs also give you a list of the top slowest transactions for your web applications, including the average, P95, and P99 response times.
00:14:06.560
You can sort by throughput and other parameters. This data gives you quick insight into which endpoints are critical (receiving the most traffic) and which are slow, allowing you to focus on fixing issues with those slow endpoints.
00:14:28.160
You can drill down further for information about specific endpoints—how much time a request spent in each step and the queries that were fired, along with their execution times. If there’s a slow query, you can debug and optimize it for a faster endpoint.
00:14:51.440
Additionally, APM tools provide data on throughput, which shows you when customers typically access your application. For example, if you're planning system upgrades or major deployments, it would be wise to do this during off-peak hours when traffic is lower.
00:15:12.400
They also give insights into object allocations. It's easy in Ruby to overlook the number of objects being created. Typically, your live objects should not exceed 50,000 at any given time; exceeding this can lead to slowdowns and higher memory consumption.
00:15:30.760
Let's examine a common pattern in Rails applications: fetching all products and looping through them to update an attribute. It may seem straightforward, but the problem lies in using `Product.all`, which loads all products at once into memory, shooting up memory usage and affecting application performance.
00:15:50.960
The solution is to use the `find_each` method to load products in batches, which avoids excessive object creation without the developer even realizing it. It's advisable to adopt this method from the beginning, even when starting with minimal data—this way, you’ll avoid memory issues as the database grows.
00:16:11.600
This metric directly relates to instance restarts, and we'll examine this further with the next slide. Notice the specific time in the graph where multiple lines are crisscrossed—this indicates when several instances restarted at a particular time of day.
00:16:32.960
It's critical to investigate what happened during that time by examining metrics such as memory, CPU utilization, throughput, and request queue times. If you form a theory about what went wrong, APM data can help verify and support your theory.
00:16:54.000
In most cases, when you have a theory but the data doesn’t validate it, it's likely that your theory is incorrect. Now that we've reviewed APMs and the metrics they provide, let’s discuss some common mistakes found in Rails applications.
00:17:12.800
The first mistake is the N+1 query. Take a look at this code where we’re fetching all posts and printing the post title along with the username. If you inspect the logs, you'll see that six queries are fired for six posts, resulting in a total of seven queries.
00:17:30.440
This might be fine for a small database, but what happens when there are 10,000 posts? You will end up firing many queries, slowing down the API response. The fix is simple: use eager loading to retrieve user information alongside posts, limiting it to just two queries regardless of the number of posts.
00:17:50.080
We encounter N+1 queries regularly in Rails applications, especially in Tune Reports. These are straightforward to fix, but let's delve into some trickier scenarios as well.
00:18:07.680
Consider this view code where we loop through the posts and render different partials based on a condition. If you examine the line calling `post.comments.count`, this triggers a database query each time to calculate the count.
00:18:27.680
Even though the comments are already eager-loaded, this results in a query for each post in the iteration. The simple solution is to replace `count` with `size`, which does not trigger a database query and is a small fix that can prevent a significant slowdown.
00:18:49.160
Next is the process of finding the first famous comment for a post—defined as one liked by more than five people. Since we can eagerly preload comments, there shouldn’t be extra queries for this.
00:19:09.840
However, the issue is that the `where` clause doesn't work with pre-loaded data, triggering a new query for each call. One way to fix this is to preload all the comments and use Ruby’s enumerables to handle the manipulation.
00:19:24.880
In this case, we could use the `find` method to locate the first famous comment, avoiding database queries entirely. If you have many comments per post, storing all objects in memory may be impractical.
00:19:46.080
Alternatively, you can create an association with specific conditions—liking by more than five people—and preload the association while loading the posts. This can be the most optimized way to handle this scenario.
00:20:09.600
Now that we've seen what an N+1 query is, it's crucial to know how to identify them. The first way is through APMs, which provide information about queries being fired, including their frequency and duration.
00:20:30.560
However, APMs don't always track everything. The second way is to use the `rack-mini-profiler`, a gem that helps profile the performance of any page and shows all the N+1 queries fired.
00:20:51.680
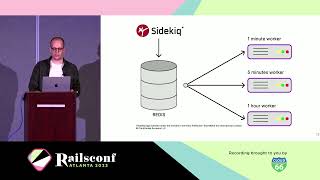
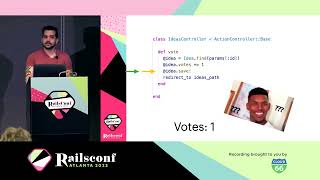
Another common mistake in Rails applications is the lack of background jobs. For example, consider the code that generates invoices and sends notifications via SMS, email, and WhatsApp—all while the user waits for a response.
00:21:07.840
This isn't an optimal user experience. Instead, we should utilize background jobs for notifications, allowing customers to continue using the app without delay. Too often, I see processes that could occur in the background still being executed during the main request.
00:21:29.440
Another mistake involves timeouts for third-party services. For instance, if we rely on a service that typically responds in 200 milliseconds but starts timing out after a default stay of 60 seconds, it could severely delay our app's response.
00:21:46.599
We should be more stringent about timeouts with third-party services. Ideally, we should limit our waiting time to 2 seconds; if there's no response, we should handle that case explicitly, such as pushing a job to retry later.
00:22:05.200
Another common mistake is neglecting database indexes. For example, consider a table with two columns of interest: name and email. If we do a simple query to find the first user with a certain email, we may notice performance issues.
00:22:15.679
Running `explain` on the query might show a sequential scan, meaning it has to scan each row in the table, leading to slow performance. The fix is adding an index on the email column to speed up the query execution.
00:22:33.040
Let's look at a query that involves two indexes—one slow and one fast. If we observe their performance, the fast index runs in 0.029 seconds, while the slow one takes 0.055 seconds.
00:22:52.880
While both are relatively fast in real-world applications, as data volume increases, the time taken by each index will also grow. At maximum data volume, the fast index doubles in query time, but the slow one may increase by 20 times.
00:23:10.960
To underscore the importance of index order: if an index is defined on section, id1, and id2, it’ll underperform if the query accesses it without the id1 condition. The order matters when defining composite indexes.
00:23:29.440
The best practices for performance could be the lack of `pluck`. When you want to gather all the values of a specific column into an array, using `map` could be less efficient than simply using `pluck`, which is significantly faster.
00:23:56.640
When benchmarked over one million records, `pluck` shows a drastic improvement in speed and memory consumption. Similarly, when looking to count records, developers often use methods like `length`, `count`, or `size` without understanding the differences.
00:24:24.480
Using `length` will load all the records into memory before counting them, whereas `count` directly queries the database. The `size` method intelligently combines both approaches based on whether records are already loaded.
00:24:42.560
When checking if records exist, it's common to see methods being improperly used. `exists?` will trigger a database query regardless, while `present?` and `blank?` load objects into memory.
00:25:06.240
To create records in bulk, avoid looping through and creating them one at a time. Instead, use the `insert_all` method, which offers substantial performance gains when dealing with large datasets.
00:25:25.760
Now, if we want to fetch users aged 51 whose names start with 'A', we see the code applies a `where` clause followed by Ruby code filtering results. While this might be easier, doing it on the SQL side is typically more efficient.
00:25:43.680
In most cases, SQL outperforms Ruby by a significant margin, so we can afford to lean on optimized database operations over Ruby iterations.
00:26:06.960
Finally, a crucial step while benchmarking is to measure performance before and after changes you think will speed up your application. One tool to help here is the Benchmark IPS gem.
00:26:39.280
Benchmark IPS reports the number of iterations per second for a code block and uses standard deviation to analyze results. A significant standard deviation can indicate variability.
00:27:02.960
By running benchmarks on different code methods, you'll be able to visually compare iterations per second, aiding in the decision-making process for performance optimization.
00:27:28.240
After setting up the gem and running the app, you’ll see a useful profiler icon. Clicking it reveals a popup with a wealth of information about request processes, how much time each step took, and SQL queries executed during those events.
00:27:54.960
The full backtrace option allows you to see complete context around log outputs, which is essential for effectively troubleshooting slow queries and determining their origin.
00:28:21.920
Now that we've discussed what APM is and the information it gives about the backend, let’s transition to discussing frontend performance.
00:28:45.200
Why is frontend performance important? This is the interface your customers interact with—they don't see your APIs or Puma threads; they care about how their experience using your product feels.
00:29:05.120
High-level metrics that reflect user experience are paramount and generally consist of a mixture of mid and small-level metrics. Unfortunately, while people tend to focus on requested queue times and response times, if the overall user experience isn't being improved, then it’s not productive.
00:29:27.600
A typical page load includes multiple steps, like DNS lookups, SSL connections, and requests to your Rails server before the response starts coming back, complete with resource loads for JS and CSS. Some of these steps can be controlled, while others cannot.
00:29:49.520
Google introduced Core Web Vitals in 2021 as a way to simplify this landscape of metrics, focusing attention on what truly matters. The three key metrics introduced are Largest Contentful Paint (LCP), First Input Delay (FID), and Cumulative Layout Shift (CLS).
00:30:12.400
These metrics also play a role in Google’s website ranking, so better values here correlate with improved search visibility. Let’s discuss LCP—this metric measures the time taken for the largest image or text block to load on a webpage.
00:30:32.919
LCP represents the main content loading speed and is a better measure than other metrics like First Contentful Paint (FCP) which looks only at the initial rendering.
00:30:56.960
When viewing the timeline of LCP, we can see its progression starts with the request for the HTML document, then loading stylesheets, and finally pulling the LCP resources.
00:31:22.200
Understanding how long each component takes is essential to improve user experience. If the Time to First Byte (TTFB) is delayed—that is, if the initial response takes a long time—users will notice the lag.
00:31:45.920
If your site's LCP is over 2.5 seconds, there's room for improvement; anything beyond 4 seconds is considered problematic. The factors affecting LCP load times include server response times, render-blocking JS and CSS, and slow resource loading.
00:32:10.880
Improving backend response times can dramatically affect LCP. Rendering-blocking JS and CSS requires careful management; if large files in the head section block rendering, the page cannot render until those resources load.
00:32:32.960
Understanding this relationship is key: CSS might block LCP rendering, especially if it takes time to process, resulting in bad user experiences.
00:32:56.240
To tackle this, you may want to inline small CSS into HTML or reduce unused CSS to load the necessary styles faster. Utilizing modern image formats like WebP can compress files effectively, leading to faster load times.
00:33:20.000
Furthermore, CDNs can help reduce load times, but ensure they proxy requests when necessary to avoid delays. It’s also crucial to minimize time to first bite by optimizing your backend response times.
00:33:43.560
In closing, if you're keen on learning more, I recommend visiting web.dev—it's a great resource for understanding performance best practices.
00:34:08.560
Thank you for attending my talk! If you have any questions or would like to discuss projects, feel free to reach out to me on my Twitter or through Ulabs' website. I hope you learned something new!