00:00:17.080
Okay, I want to first welcome everyone to the distributed track at Rails this year. This is the first year that we've been doing a distributed track, so I'm excited to be able to give you guys a talk on distributed request tracing.
00:00:22.760
A little bit about myself real quick: my name is Kenny Hoxworth, and I am a software engineer at Twilio. I'm actually not doing any Rails development anymore, unfortunately. However, I have taken a number of the concepts I've learned from the scaling architectures that Twilio has and thought there is a lot of stuff that can actually come back to the Rails world. That's kind of what I want to bring to you all today.
00:00:39.640
Before we get into the investigation that led us down the path of Twilio's architecture, I wanted to discuss what distributed request tracing is. Distributed request tracing can be thought of as a profiler for your distributed system. It tracks a request as it enters your distributed system. We have profilers for a variety of other frameworks and programming languages, where you can break down and actually see which function calls are taking the most time and what the exact stack trace for each function call is.
00:01:05.280
A distributed tracer essentially provides the same profiling for a request cycle as it enters into a distributed system. Given this diagram, you can see a profiling diagram of a full-scale trace running from end to end. It illustrates how a request enters and exits a system, including a web service call that was the first call made in the distributed system, along with a database call, and how everything gets handed off to a worker thread to finish the processing after the web service has done its job.
00:01:24.760
So, I work on the messaging team at Twilio, and for those of you who are not familiar with what Twilio does, we provide an API for voice communication, allowing users to send and receive phone calls through the Twilio API. We also provide a messaging API that enables sending and receiving text messages and MMS. For received MMS, we also offer webhooks that go out to your servers to figure out what exactly should be done with each message, allowing your servers to respond accordingly.
00:01:49.760
One aspect of the messaging stack at Twilio is set up in a distributed fashion, where each service that handles inbound or outbound messages operates on an individual service hosted on AWS. At any given time, there are nine different components communicating when a message comes into the service via the API until it gets handed off to the carriers.
00:02:07.000
We ran into some problems, so this is just a basic overview: a message comes in, is handed off to another server, then to another, and so forth. There’s some DB persistence communication going on as well. The distributed tracing system initially seemed a little bland because you don't necessarily need it for passing requests from system to system. Profiling can be useful as it provides valuable information about latencies and other issues between your services.
00:02:32.520
The real advantage of distributed tracing comes when you start scaling. Twilio's services are scaled to meet the current needs, and we can have 10 to 20 nodes running for each individual service. Often, customers or support personnel come to us and report issues, like how an SMS may sometimes take 2 seconds to send as opposed to being nearly instantaneous or how an MMS can take even longer.
00:02:59.199
Additionally, it can be challenging to trace issues in a distributed system. Log parsing and tools like Logstash can help, but recreating the entire event from entry into the system to completion is incredibly useful for both debugging and analytics. It allows us to know exactly which code was running on which server at any point, to identify if a specific server had any memory issues while others in the load balancer were unaffected.
00:03:22.920
For instance, when you add distributed tracing, you can follow the exact path that a message travels within your system. Distributed tracing gives essential insights into average performance and helps identify problems like 'bad nodes,' where some nodes may run out of disk space or experience unplanned issues.
00:03:35.760
If you have a robust system, it should retry and pass failed requests back into the load balancer. Most of the time, these problems may not involve noticeable error messages visible to the customer, which makes it hard to determine the origin of the issue using just raw error logs. By using distributed tracing, you can accurately follow a request's path and identify which nodes need investigation, improving the efficacy of debugging and future scaling plans.
00:04:07.080
Now, you might be wondering what exactly constitutes a distributed system. Essentially, if you're running a service that comprises two or more components communicating with each other, like a web service and a database, you have a distributed system. The more services you add, the more complex the distribution becomes.
00:04:15.839
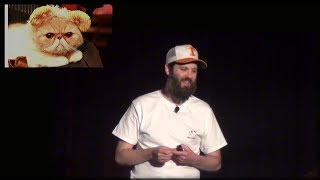
Laying the groundwork for a good tracing framework is straightforward if you start from the beginning, but it can become challenging to instrument all of your services after you've implemented them. To illustrate this, let’s go through a lighthearted example of a service we could consider developing: 'Cats as a service.' We all know the internet needs more cats!
00:04:31.760
We aimed to create an API that allows users to retrieve any cats they want and integrate them with their services. The idea being that we are providing a fun service that enables users to send images of cats. Starting with a very basic architecture, we would offer both an API and a web interface, sending requests through Twilio to our customers.
00:04:55.520
Let's consider that our service is straightforward and might not seem to warrant distributed tracing integration. However, as soon as we begin adding elements, like social aspects or authorization layers, quickly, we may encounter scenarios resembling issues in a more substantial distributed system.
00:05:12.640
If a venture capitalist (VC) happened to be present in this room today and envisioned creating a cat-spamming service linked to social interactions, the complexity would amplify greatly. Our basic service could expand with an API, a web interface, worker processes, media fetching components, messaging infrastructures, and could lead to many different communications between components, further necessitating effective tracing.
00:05:53.720
At this stage, it's clear how distributed tracing could be significantly beneficial. Once we start scaling and introducing multiple ingress points and various services, it becomes hard to identify where issues may arise without a reliable tracing system in place.
00:06:08.919
For any service to build a good tracing system, three crucial goals should be focused on: First, it needs to have low overhead to minimize the impact on server resources. Second, it needs to be scalable from the start, allowing developers to add services without worrying about the tracing system. Lastly, the instrumentation should be transparent and seamless to give developers peace of mind.
00:06:24.999
Avoiding the logistical nightmare of having developers implement tracing manually across a large distributed system is essential. There are existing tracing systems like XTrace, which introduced academic papers in the early 2000s; however, some lack Ruby instrumentation, with some commercial solutions like APNet’s Traceview being available.
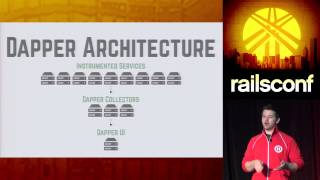
00:06:45.759
Dapper, developed at Google, shares similarities with these systems but further improves scalability. Dapper uses low-latency logging to prioritize necessary traces and statistics while also implementing sampling rates to manage request traces effectively. Google can achieve seamless integration and monitoring through complete control over their communication paths.
00:07:18.719
An open-source initiative stemming from Dapper is Zipkin, which has become a popular tracing solution. It operates on a custom RPC layer called Finagle, integrating well with systems communicating through binary frameworks. Zipkin is highly configurable and doesn't require all instrumented services to communicate through a log collector.
00:07:38.639
The interface is straightforward, allowing you to examine individual services and see traces easily. Implementing instrumentation for a Rails application using Zipkin is relatively straightforward. The initial setup involves installing the necessary components and configuring middleware for tracing.
00:08:06.479
Fortunately, the Ruby setup is easy as well, utilizing the Scribe gem alongside the Finagle Thrift gem to handle trace IDs and communications. Additionally, the Zipkin Tracer can automate much of the inbound request tracing process within a Rails service.
00:08:34.960
While there are challenges integrating it with specific components like Active Record and messaging queues, efforts are being made to improve this aspect. At the moment, tracing can still be performed but involves some additional wrapping calls.
00:09:02.440
I want to conduct a quick demo to show how the system works, so bear with me while I set it up. Here we have the Cat Spammer interface we created, and I will soon demonstrate how it allows users to send images of cats as messages through the Twilio API.
00:09:38.280
As I prepare for this demo, let me explain that it’s somewhat difficult to verify everything is functioning without going through actual tests beforehand. I will input my own number to get a cat image sent to my phone. Let's see how that works!
00:10:05.960
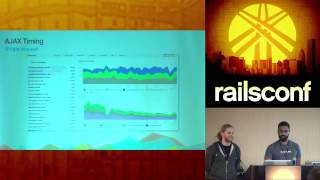
Here we go! As things are coming together, remember that the backend services are built to communicate, which allows for creating a trace of the request as it moves through the system. This could be an excellent way to visualize the tracing we’ve been discussing.
00:10:37.560
Now regarding tracing, we can observe how each service is called through the system and identify potential areas where latency may occur and where further optimizations can be made. Viewer reports like these create opportunities to improve performance across our services.
00:11:02.320
This demo concludes my presentation on distributed tracing with Zipkin in a Rails application. I'm happy to address any questions you may have about the integration process or performance I've presented here.
00:11:18.840
The actual rail instrumentation is quite easy to execute and offers straightforward logging pathways that can give additional insights. Should you need more information about these processes or wish to send your own cat images, please visit catspammer.com. Thank you!