00:00:15.470
Hello! Holy crap, it’s packed! I did not expect this many people for this type of talk.
00:00:21.560
Thank you so much for joining me today. I'm Ryan Davis, and today I'm going to be talking about graphics and running simulations.
00:00:27.359
I should note that despite the title, there will be no Wizard of Oz references.
00:00:32.550
I’m very sorry about that, but it sets a level of expectation regarding my graphics prowess, and I just don’t have that.
00:00:39.570
Something I like to do in all my talks is to set expectations up front. This talk is about half show-and-tell and about half tutorial.
00:00:46.320
It has a medium level of code compared to my normal talks, and it is suitable for developers of all levels.
00:00:51.899
I have about one hundred and eighty slides. If I give some time for Q&A at the end, that works out to about five slides per minute.
00:00:58.469
But first, a little bit about me. I've been coding professionally for a long time—eighteen of those years in Ruby.
00:01:03.960
I am the founder of Seattle.rb, the first and oldest Ruby Brigade in the world.
00:01:09.060
I am the author of MiniTest, Flog, Flay, Ruby Parser, and a whole lot of other gems.
00:01:14.189
I figured out this year that I have pushed over a thousand gems into the Ruby ecosystem.
00:01:20.880
I’m a developer’s developer. I really enjoy building tools that we all use.
00:01:27.420
I run Stealer Bee Consulting at StealerBee.com.
00:01:34.229
I really hate these types of slides in these talks. I’m sorry about this but I need new clients, and speaking is my primary lead generator.
00:01:42.509
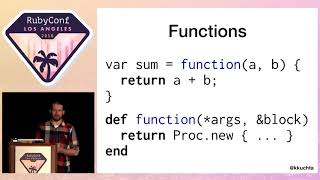
So, what is graphics, and why does it have such a boring name? I was tired of nonsensical names like MiniSkirt and Nokogiri.
00:01:47.610
Both 'graphics' and 'simulation' were available, and I literally flipped a coin and wound up with 'graphics'.
00:01:53.880
Quite simply, graphics is a gem that I wrote that you can install right now.
00:02:00.450
Unfortunately, it's still in beta, so you have to use --pre. I apologize for that.
00:02:06.719
I’m going to try to fix that today. It tries to provide a simple framework for implementing simulations.
00:02:12.930
This can include digital art, custom visualizations, and even games.
00:02:17.970
It is designed to follow grade school mathematical conventions, not game programming conventions. I’ll elaborate on this later.
00:02:25.440
I want to demystify graphical programming, generative art, simulation, scientific visualization, and simple games.
00:02:30.900
I want to show that these topics aren’t actually hard.
00:02:37.050
Perhaps most importantly, I don’t want to just add a new tool to your toolbox.
00:02:42.120
I want you to be able to use data to add an extra dimension to your work or to understand a problem that you’re facing.
00:02:48.870
But first, a simple word of warning: I am not an artist or a graphical programmer.
00:02:55.460
I’m aesthetically challenged, especially in electronic mediums. Look at my website for proof!
00:03:03.030
I don’t have a strong math background, particularly in linear algebra and other areas heavily used in graphics.
00:03:11.250
I’m not a scientist, and I’m definitely not a game developer. I will never write the next version of Doom.
00:03:17.130
This makes me a perfect candidate to try to write a graphics framework for the rest of us.
00:03:23.550
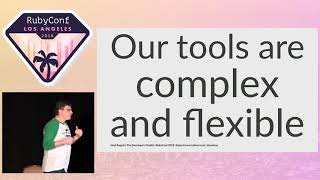
I’m damn good at making tools to help me and other developers out.
00:03:29.190
So, I’ve made this gem to be as useful and powerful as possible while simultaneously making it as simple as I could.
00:03:35.100
I prefer real examples over theory and marketing fluff, so let’s quickly get concrete with a real and tangible example.
00:03:40.560
Let’s start with a black window. This is all it takes: you require graphics.
00:03:45.990
You create a new class and subclass graphics:::simulation, where G:::S is just shorthand.
00:03:51.660
In this talk, I’ll be including a white background in all the classes because I wasn’t quite sure how good the projection would be.
00:03:59.280
You know, a thin line on black might not come through.
00:04:04.860
You instantiate it, tell it to run, and you wind up with a blank canvas that defaults to half the width and height of your actual screen.
00:04:13.050
To actually draw something, we have a draw method where we call super.
00:04:18.660
Then we declare a circle in the middle of the window with a radius of 15, set to be blue and filled.
00:04:23.820
You see a circle, but there’s no state or behavior with this setup.
00:04:31.080
To improve this, I want to make this a bit more complex.
00:04:36.240
I declare a body subclass called Ball, and I set the count to be one.
00:04:41.669
Then I create a class called View with a draw class method that takes the window and the ball to draw.
00:04:48.000
The drawing code uses `bettaX` and `bNotY`, but it’s otherwise very similar. Next, we get rid of the original draw method.
00:04:56.159
Back in the simulation, I add an initializer and declare that the ball is going to be used by calling register bodies with the result of populate ball.
00:05:02.099
It’s not too different; everything has just been displaced a little.
00:05:08.699
This allows for state and behavior, and this is when things start to get interesting.
00:05:14.240
We can add an initializer to the ball, call super, and then set both the angle and magnitude to random values.
00:05:21.900
The X and Y positions of the bodies are determined via super.
00:05:28.080
Now, to add behavior, I want to introduce an update method to the ball. Is that running? Interesting!
00:05:33.990
It's running, but it's not showing on my screen, so I need to stop looking at it for now.
00:05:40.949
We’re going to tell it to move and then wrap around if necessary.
00:05:46.409
This is similar to how the classic game Asteroids works. If we change from wrap to bounce, where a 0 means no friction, we will get behavior similar to the classic game Pong.
00:05:54.569
If we add a small down vector to the ball's velocity with a default friction (i.e., not zero), we can simulate how a real ball would bounce.
00:06:01.139
We’ve created three very different behaviors with three very small changes.
00:06:09.240
Finally, by simply changing count from one to 25, we make this much more interesting and dynamic.
00:06:16.949
Now, we have a simulation class that declares a white background and states that the ball should be used.
00:06:23.759
That's all it does. We have a body named ball that will populate 25 balls in the simulation. We have gravity constants, some random setup, and very basic behavior.
00:06:30.870
The balls are bouncing under constant gravity, and finally, the ball declares a view class that defines how to draw a ball in a stateless manner.
00:06:35.940
Twenty-eight lines of code ultimately make it only look complex because it’s split across three slides to make it readable.
00:06:41.890
Its entirety is only barely formatted to fit on the slide, and it's not too bad in my opinion—it really is easy enough that anyone can do it.
00:06:47.650
So, this gave you an idea of what graphics programming looks like with the graphics gem, but that is only the tip of the iceberg. Let's explore more.
00:07:01.120
Let's start with generative art. Here are criss-crossing lines with random jitter added to their X and Y.
00:07:07.960
They are very lightly colored translucent black, but since there are 300 of them, they quickly become solid dark black.
00:07:13.300
This is the exact same code with slightly tweaked behavior: instead of crisscrossing the lines, each segment is jittered away from the previous.
00:07:19.060
This creates a fountain or jet effect. This is a complex wave pattern.
00:07:24.970
What's cool is that this is not 3D math; it's actually really simple underneath—it's just emergent behavior that looks 3D.
00:07:31.960
This artwork was contributed by Joss Cheikh, who’s been posting amazing videos using graphics and has a lot more graphical skill than I do.
00:07:39.040
Here is another piece by Joss Cheikh—I just can’t get over what he’s done with the graphics gem. It kills me!
00:07:44.380
His art is set to music, while mine is not. Sorry.
00:07:50.650
This is an emulation of Piet Mondrian’s artwork with animations added, and we’ll see more of that later.
00:08:03.340
A few months back, I attended an art exhibit where several pieces showed their maths, so I took a picture of this one.
00:08:08.830
I translated it into Ruby; it’s only 42 lines of code.
00:08:14.770
Let’s look at some more math-oriented examples. I hope this reads well. Oh, it reads fine! That’s great!
00:08:22.960
This is a very simple proof of concept demonstrating how you could implement the Logo programming system in Ruby.
00:08:29.350
It's taking terminal input to a drawing turtle to draw a square, and this is the standard fractal tree.
00:08:34.780
This was contributed by Justin Collins. This is a simple visualization of Quadrant 1 math with a polynomial—nothing special, really simple.
00:08:40.660
This also reads really well. This projector is fantastic! Buy one!
00:08:46.390
This simulates bouncing balls expanding a polygon to calculate the value of Pi.
00:08:52.400
It's hard to see, but the Kern estimate of Pi is shown in the window's title. It only reaches 3.13 by the time the video loops.
00:08:59.430
However, it does hit 3.14 at some point.
00:09:04.310
Now, the part that fascinates me the most is simulations. Here is a more complete version of the bouncing balls example that I gave before.
00:09:21.780
We’ll look at two very different versions of Conway's Game of Life, Boyd’s or a flocking simulation, which we’ll explore more later.
00:09:27.150
We have two different versions of fluid dynamics simulations.
00:09:33.120
These use the same maths entirely but employ different visualizations to show the current density.
00:09:39.540
A colored gamut is being used on the right, and then you can see little spheres as they hit the bottom while the density grows.
00:09:47.460
This canvas drawing represents the Vance or virtual ants algorithm which we’ll see more of later.
00:09:57.690
This might be a little hard to see, but this simulates many randomly moving bodies with collision detection and handling trails so you can see their paths.
00:10:03.240
There’s also random goal-changing behavior.
00:10:09.930
The reason why I got into this in the first place is that I wanted to write a zombie outbreak epidemic simulator.
00:10:15.270
This shows one of the very few cases where the priests win and kill all the zombies.
00:10:21.510
While not an explicit goal of the gem, it is totally possible to implement games.
00:10:27.420
This example shows the use of collision maps and sprites. This is a vector-based tank that you control.
00:10:35.100
Unfortunately, I’m driving it poorly. This is a bitmap version with a slightly more sophisticated implementation.
00:10:40.830
This is where I started to switch to the Model View Controller setup that I showed you before.
00:10:46.080
It even makes pew pew noises when you shoot! This showcases user interaction using the mouse.
00:10:51.840
Finally, here is a random maze generation using Jamie's 'Mazez for Programmers' book.
00:10:59.550
He gave a really good talk in Salt Lake a couple of years back, and I was enthused by it, so I implemented it during his talk.
00:11:05.639
Now, I would like to take a moment to talk about how graphics feel different to me to emphasize my goals.
00:11:17.279
While I’ve been working on this, I want to optimize the library to be approachable.
00:11:24.300
I aim to ideally target workshops for beginners, other non-computer science folk, and non-game developers.
00:11:30.300
I want this to be understandable and easy to install.
00:11:36.899
There are platform-specific external dependencies, and I apologize for that, but it’s essential for performance.
00:11:41.970
I want the graphics gem to be a single gem install that works like any other gem.
00:11:48.240
I have removed and normalized as much as I can to make it usable for anyone with any background.
00:11:54.660
It is optimized to get the first pixels on screen as quickly as possible, with as little boilerplate as needed.
00:12:00.029
Providing new developers quick and easy feedback is very empowering.
00:12:06.329
While there's no ending yet, a single file is all it takes to experiment; it's simply a matter of editing and running.
00:12:14.550
I want this to operate like any other script; I don’t want it to be an AMP or all the rails or other large frameworks.
00:12:19.889
Wherever possible, graphics uses real math unless you need to use the computer's built-in trig functions.
00:12:26.160
The trig functions are always specified in radians, but everything in graphics uses degrees.
00:12:31.790
Graphics uses quadrant one math just like you used in grade school.
00:12:37.319
Unlike game math coordinates, which looks like quadrant four for some reason (where Y is still positive even though it's going down), graphics uses the right-hand rule.
00:12:44.370
Here, 0 degrees is to the east, 90 to the north, etc. Again, just like in grade school.
00:12:51.990
This ensures that the mathematical concepts you learned in grade school still work as intended.
00:12:57.839
It reduces the cognitive load when implementing your simulations.
00:13:03.360
Moreover, graphics is opinionated. It wants to be pretty.
00:13:09.470
There are over 20 graphic primitives available in graphics, with more to come.
00:13:14.819
Everything is anti-aliased by default; alpha blending is automatic based on the color that you are drawing.
00:13:20.010
There are plenty of helpers to keep your code as clean as possible, and there will probably be more to come.
00:13:25.800
Now, let’s talk about how this works. First, we’ll discuss the update and draw loop at the highest level possible.
00:13:31.230
We have a model, which is the state of your simulation.
00:13:37.650
Each turn, that model gets drawn or rendered onto a canvas.
00:13:44.430
In turn, that canvas gets copied to the actual screen.
00:13:49.530
Our loop is really just three calls: update, which changes the model for this turn; draw, which renders the model onto a canvas; and present, which finally copies that canvas to the screen.
00:13:57.390
As an aside, this is what I want to feel like. On every turn, there’s a new blank canvas, you draw some things, and then you copy them to the screen.
00:14:04.830
Under the covers, there might be two or more canvases that take turns updating and copying to the screen.
00:14:10.650
These are details you don’t really need to know most of the time, but they can trip you up on occasion.
00:14:18.810
There’s other stuff involved, but the basic run loop works like this: update n times, where n is usually one.
00:14:23.970
Then draw and render to the screen. The update, by default, tells all registered bodies to update themselves.
00:14:30.240
The default draw phase clears the canvas, then tells each registered body to render itself via the body’s view class.
00:14:35.370
It’s a bit more than this, but this is the gist.
00:14:41.910
Finally, the render phase calls down to the lower layers: the graphics engine, to do the stuff and make it actually display on the screen.
00:14:48.870
There’s a very basic class hierarchy. Abstract Simulation has nearly all the meat in it.
00:14:53.880
If anything, I should just rename it to Simulation. Graphics Simulation is the class you’ll use 80% of the time.
00:15:00.570
It has all the normal functionality described so far.
00:15:05.640
If anything you do changes over time, this is probably the class that you want to start with.
00:15:11.400
On each turn, it clears the window by default and uses very smooth drawing; by that I mean it uses double buffering under the covers.
00:15:18.090
The other 20% of the time, you might want to use graphics drawing.
00:15:24.660
It does not clear the canvas on each turn and uses a single canvas that is persistent throughout all turns.
00:15:31.140
It uses a single buffered draw from that one canvas. It’s static, so it’s meant to draw things that are either entirely aesthetic or that start off static but are additive over time.
00:15:37.170
This makes for good plots and simulations, or art, where the canvas itself is part of the state.
00:15:43.920
Okay, that's well and good, but what can you actually do? How do you draw things?
00:15:54.510
Let’s look at each one. For the sake of making these slides readable, I’ve defined the following values and methods for use in the examples.
00:16:01.230
We have a default margin of 50, random X and Y, a random color from all the registered colors that defaults to, and a random boolean.
00:16:07.170
For things that need multiple different values, I’ve got a `rand50` method that returns a random integer between 0 and 50.
00:16:13.350
So, clearing the screen: not much to say here. The first thing you almost always want to do on each turn is to clear the screen.
00:16:18.779
This happens by default when you use simulation. The point is the most basic building block, but not necessarily something you’re going to directly use very often.
00:16:25.140
Here we are creating a thousand random points on each turn with random colors, and it just basically becomes noise.
00:16:31.860
Drawing a line is pretty straightforward as well: it takes two pairs of X and Y values and a color.
00:16:43.160
Here we’re using the window height and the current turn number to animate angles.
00:16:49.500
A line takes a single X and Y, an angle, and a length instead of a second point.
00:16:55.110
Each line of `VLine` takes one coordinate and spans the whole window with your specified color. This is useful for plotting stuff.
00:17:01.320
Circle takes a middle point and a radius; this is the first primitive with an area, so it also takes a boolean declaring whether or not it’s filled.
00:17:08.900
Ellipse is just like a circle but takes two radius values.
00:17:15.150
Fast Rect is a filled rectangle that is always filled, taking an origin point on the bottom left, a width, a height, and a color.
00:17:22.740
This uses a lower-level drawing function that should be faster, but these days it probably isn’t anymore because everything is terribly fast.
00:17:30.000
Too fast, in fact! I had to add VSYNC to make things viewable.
00:17:42.740
Rect is the same as build rect, but it also takes a boolean for whether or not to fill.
00:17:48.419
Polygon takes any number of points and a color. I probably need to extend this to allow for filled polygons, but nobody's asked for that yet.
00:17:54.630
Bezier allows you to draw curves, but not in a terribly approachable way.
00:17:58.639
You kind of need to be more of a graphics expert for this. I’m not going to explain this one too much, but I want to add splines.
00:18:05.420
Here’s one of the busiest slides I've got.
00:18:12.880
Sprite that call on top takes dimensions and a block. During block execution, drawing goes into a separate canvas, and that image is returned.
00:18:19.260
Blit takes that image or any image and draws it at a location, potentially with an angle and/or scale.
00:18:25.140
Instead of using sprite to create a canvas, you can call `image` to load a bitmap from a file.
00:18:32.960
Render text takes a string, a color, and an optional font. There’s always a default font, and it returns an image.
00:18:39.850
Put is just like blit, except that it uses the bottom left corner as its origin.
00:18:51.280
Here, you can see it rotating on that corner, unlike the tank and turret from before. Text renders this string.
00:19:03.539
Finally, there are some helper functions to render the screen.
00:19:09.280
FPS prints the frames per second—it's a rough estimate, but it’s close enough.
00:19:15.660
Mouse returns the mouse state and I use that with the debug function that takes a format string and arguments.
00:19:22.160
It prints for debugging at the pixel level, or just for fun. You can also save the current screen as a PNG.
00:19:29.480
So let’s build up some real examples starting with generative art. I throw pottery; I enjoy it.
00:19:38.650
It’s fun to struggle with. I don’t feel the same way about computer art; the struggle isn’t fun.
00:19:43.990
A few months back, I had an interview where they asked me to generate art in the style of Piet Mondrian.
00:19:49.370
I could go on about Mondrian for a long time, but you should check out his work; it’s really good.
00:19:56.459
Normally, I would start with a hand-drawn sketch of what we're going for, but here we actually have a finished product to emulate.
00:20:04.710
We start where we always do—with a blank canvas.
00:20:09.420
I’ve added a grid to help visualize where we want to go.
00:20:14.760
It includes some stuff I won’t explain, mostly to make the slides more readable.
00:20:20.860
Let’s focus on the art method. We want thick lines that span the window.
00:20:27.140
We have the width and height of the window, so let’s first draw two lines: one vertically at 120 and one horizontally at 80.
00:20:33.680
The width is set to 20, which is the width of the lines that we’ll create.
00:20:39.380
Next, let’s use some helpers to generate a random number of grid-aligned X’s and Y’s, then we’ll draw them with the previous code.
00:20:44.680
It’s really not much different; there are just some loops.
00:20:49.970
This looks good; now we just need to fill in some regions.
00:20:55.330
As an aside, I love the fact that in Ruby, `rand` can take number ranges—it makes code prettier than the systems we used to use in C.
00:21:01.180
This is gross, I admit; I pulled it out for nerds.
00:21:07.150
I created a method for this slide; basically, we randomly pick some regions based on the X’s and Y’s generated earlier.
00:21:13.340
Then we find the area of those regions and fill them with a random primary color.
00:21:20.700
I hope this translates well on audio for the recording.
00:21:29.070
Honestly, that’s not bad, and yet they still didn’t offer me the job, nor did they provide me feedback on how I could improve.
00:21:36.900
So I wrote a blog post about it and published it with a question asking how they could treat interviewees better.
00:21:43.320
Now, onto something more relevant to your job: let's work out some basic data visualization.
00:21:50.100
Let’s say you have a lot of data, but you don’t yet know what it means. This is a simple example.
00:21:57.680
Gathering data and plotting something like message size over time spent to process.
00:22:03.620
As Rubyists, we’re incredibly good at gathering data, whether that’s parsing it out of text or pulling it from a database.
00:22:10.340
Getting the data is rarely a problem we face, so I won’t delve into how that data is gathered.
00:22:16.860
Let’s assume that we have it. Looking at just under a million data points and poking at it doesn’t help.
00:22:23.050
We need to visualize it and see if there's a visible correlation.
00:22:30.100
Typically, at this point, someone would likely suggest grabbing a whole new language like R.
00:22:36.000
It’s very good at importing and manipulating data, but it’s also a pain and may be overkill if you're not doing serious statistics.
00:22:44.480
Others may suggest using Excel, as it has great plotting capabilities, but getting large datasets into a spreadsheet is a hassle.
00:22:51.720
Now you have two problems, and we don’t have many good options in Ruby for this.
00:23:00.030
We reach for tools in other languages like R, D3 in JavaScript, and that keeps us from improving our own tooling.
00:23:07.460
I consider this a problem, and while I'm not solving it, I want to address it a bit.
00:23:15.340
We will start with a sketch of our system. That didn’t come through well, but whatever.
00:23:23.680
Basically, we’re going to create a very busy plot trying to show time over size to identify potential issues.
00:23:29.240
When I say sketch, I mean it—this is hand-drawn.
00:23:35.030
So as usual, we start with a basic subclass of simulation to make a blank window.
00:23:40.420
This time, I’ve declared a grid to help.
00:23:46.830
Let's change the initialize method to store the data being passed in, and scale it to the size of the window.
00:23:53.070
Then we’ll use group by to gather and count the same values and apply math log to keep the values similar.
00:24:00.060
Otherwise, everything will appear as a big black screen.
00:24:07.840
Now we can add the draw method. We simply walk over the data, plot a gray point at X and Y, and plot a translucent red circle at that point.
00:24:13.470
This will show where there’s a large spillover.
00:24:19.560
If you zoom in, you can see that the very light red is heavily spilling over in some areas.
00:24:26.950
These are areas you might want to investigate.
00:24:33.470
Now we know where to look, so have fun with it! Add features, label those axes, and input values.
00:24:41.929
Make it easier to repeat later. This might not be the right data to visualize, or the way to visualize it. You need to experiment to extract information from raw data.
00:24:49.070
Running simulations is why I wrote this library.
00:24:55.220
Here are some simple examples of how to do that, like Langton's ants, or Vance, which is short for virtual ants.
00:25:02.680
They live on a 2D plane and have a simple set of rules they execute each turn.
00:25:10.320
If an ant is on a white cell, it makes it black and turns left; if it’s on a black cell, it makes it white and turns right.
00:25:16.480
Then, the ant moves forward one and repeats.
00:25:22.420
Turns out they are Turing complete on a 2D surface, where their state includes their current position and direction.
00:25:28.680
This is what it looks like for a single ant after around 11,000 iterations of this rule.
00:25:34.920
As always, we start with a blank canvas.
00:25:41.800
I’m leaving out some mechanics for brevity, but otherwise, this looks the same.
00:25:47.130
This reads pretty close to the rules: if it’s white, set it to black and turn left; if it’s black, set it to white and turn right.
00:25:54.200
Finally, move it. Here it is after only a few turns.
00:26:00.620
This is how it looks after about 6,000 iterations—not bad! I like it.
00:26:06.930
Next is Boyd’s. Boyd’s is an artificial life program that simulates the flocking behavior in birds, fish, or other systems.
00:26:13.080
Wikipedia does a great job explaining this. It’s interesting! Boyd is also a New York metropolitan dialect pronunciation for bird.
00:26:20.370
Boyd's use a combination of simple rules to determine flocking behavior.
00:26:27.520
At a minimum, it requires cohesion, separation, and alignment.
00:26:34.250
But more forces can be added, like wind or water, for more accurate simulation.
00:26:40.900
So, we start with the usual setup: declaring a simulation with a white background and FPS display.
00:26:48.560
This was really slow to start, so I registered the body—25 Boyd's—and initialized them with random angles and speeds.
00:26:55.450
I declared that they should be drawn as simple black circles, with red lines showing their vectors.
00:27:01.790
Boyd’s try to fly towards the center—rule number one: cohesion.
00:27:07.520
Boyd's aim to fly towards the center of mass of nearby Boyd's. This is what this code does.
00:27:13.370
Calculate the center mass, find the difference, and return 1% of that.
00:27:21.140
Rule number two: separation. Boyd's try to keep a small distance from others.
00:27:27.960
This involves finding nearby Boyd's that are too close and calculating a vector slightly away from them.
00:27:35.380
Rule number three: alignment. Boyd's try to match the velocity of their nearby Boyd's.
00:27:40.680
This simply involves calculating the difference in average velocities.
00:27:47.160
Now, each turn, sum those vectors and add them to the current velocity, clamped to a limit.
00:27:53.200
Finally, at the bottom, we move and wrap around the window.
00:27:59.120
Here’s the final result. Very quickly, the flocking behavior takes over, and they converge while maintaining a safe distance from each other.
00:28:05.120
Simple rules add up to very organic-feeling behavior.
00:28:11.410
Let’s dissect that tank game from the gallery. I won’t implement the whole thing here for time…
00:28:17.760
but I want to show how to do interactivity.
00:28:22.990
Of course, we start with a sketch of what we’re going to do.
00:28:28.580
Nothing fancy—just a simple tank with an independent turret in an arena.
00:28:34.200
We sketch that up and formulate the behavior we want.
00:28:39.970
For now, the tank will be moved by the arrow keys while ‘S’ turns the turret.
00:28:45.720
Everything else, like firing, is an exercise for the viewer.
00:28:51.050
As always, we start with a blank canvas and initialize the tank to the middle.
00:28:58.200
We need to add a turret for an angle independent of the body angle.
00:29:04.080
Now, we draw our tank into a sprite.
00:29:10.370
Protip: this is incredibly error-prone, so give your tank a different color until you figure out all the coordinates.
00:29:15.770
Draw extra boundaries and diagonals to help you gauge your positions.
00:29:21.300
Little adjustments will help a lot, and then we use blit to place the tank and turret on the canvas.
00:29:28.120
At this point, the game starts, and you can see the tank just sitting in the middle.
00:29:34.520
While it’s boring without functionality, let's give the tank the ability to turn and move.
00:29:40.480
Once that’s working correctly, we can plug in those event handlers using add key handler.
00:29:46.290
We can declare the handlers and have them control the state of the tank.
00:29:52.080
Here is our final result for this talk, at least! Obviously, this can easily be extended.
00:29:59.040
Consider adding firing bullets, sound effects, multiple tanks, targets, scoring, etc.
00:30:05.080
I simply can’t fit all of that into this talk, so here are the patterns we've seen so far.
00:30:15.980
Start with a sketch—figure out what you want to see.
00:30:22.160
Next, determine the behavior rules, then start coding with a blank canvas.
00:30:28.050
Build things up individually—don’t try to do everything at once.
00:30:34.400
This is too much stuff! If you're unsure, start expanding through drawing.
00:30:40.540
Get all your images, sprites, and backgrounds in place. Move to simulation when you have more dynamic behaviors.
00:30:46.300
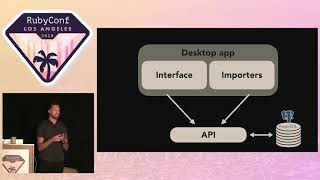
Using MVC works well here: the model mostly consists of body instances, while the view has all bodies with an external draw routine.
00:30:52.880
The controller is the simulation running the update and draw loop while maintaining shared state.
00:30:58.740
I think the declarative form of coding works very well for graphical programming, so push towards doing less in your methods.
00:31:05.360
Consider using decorator modules instead—just remember to always call super, otherwise things might not show up.
00:31:14.280
Hopefully this talk has convinced you that you could benefit from an added visualization tool in your toolbox and that graphics is a good fit.
00:31:22.900
Thank you!
00:31:34.140
The question is, what lies underneath?
00:31:39.190
Yes, it is a C library called LibSDL, and the unreleased version of this code that’s coming soon has switched from SDL1 to SDL2.
00:31:47.170
This switch has improved performance significantly, allowing pixel-perfect colors, and better alpha blending.
00:31:52.180
So it’s an improvement!
00:31:58.780
Is it possible to do this in Ruby? I don’t see why not.
00:32:07.720
There’s a small C extension providing the wrapper to SDL, so it should work the same.
00:32:14.740
What limitations do I currently see? I don’t think there are enough decorators.
00:32:19.840
I also believe there aren’t enough drawing primitives; Josh Cheikh has used this a lot.
00:32:26.320
He’s requested features like thick lines instead of having to create them manually.
00:32:33.760
Now that I’ve switched to SDL2, the performance problems have faded.
00:32:39.430
I went from 30 frames per second to 200 frames per second by switching to SDL2.
00:32:44.920
I actually had to slow the game down; otherwise, simulations would pass before you could see anything.
00:32:52.960
As for coloring aspects, there are improvements here, too.
00:32:58.840
I hate eyeballs and brains; color perception is very complex.
00:33:06.100
Turns out, magenta isn’t an actual color, and brightness intensity can be very challenging.
00:33:13.059
If you want to do scientific visualizations, you’ll face difficulty due to intensity differentials.
00:33:21.100
If you use color systems like HSV, they may present challenges as blues are darker than reds and yellows.
00:33:29.800
You could end up with vastly different intensity variations.
00:33:37.780
A color map called HCl tries to address color perception differences.
00:33:44.050
This can also create nil values and mess up your visuals.
00:33:51.300
So, I’ll need to figure out how to overcome these challenges.
00:33:56.420
I'm still exploring options.
00:34:03.750
What do I suggest for testing?
00:34:09.040
While doing these things, definitely test your models from head to toe.
00:34:17.400
You don’t have to test emergent behavior; that will materialize on its own.
00:34:24.440
So, I would test all models thoroughly, but not necessarily the view code.
00:34:31.300
If I did, I’d save off a bitmap and attempt to compare it against a golden sample, but I dislike golden tests.
00:34:37.470
The controller and view code work simply—the way they operate is primarily declarative.
00:34:46.110
I don’t see the value in testing declarative code, which is usually straightforward.
00:34:54.560
Headless operation is, of course, totally possible! However, I have been considering breaking out the graphic aspects.
00:35:02.580
So the graphics would be separate from simulation, allowing purely numeric operations.
00:35:10.310
There’s a logging function that lets you register a logger to run every hundred ticks.
00:35:18.770
You could easily avoid creating a window and have your routine perform the update loop while logging instead of the update and draw.
00:35:26.270
I haven’t completely separated that yet, but it would certainly only require ten lines of code to do it.
00:35:32.920
You could change the initializer around to avoid adding the window and keep everything else the same.
00:35:39.430
And I can absolutely add that functionality!
00:35:46.520
Lastly, is it possible to add new primitives if you're okay coding in C?
00:35:53.130
It's totally possible! I’m currently using SDL GFX as an extender of the standard primitives.
00:36:02.840
I’ve wrapped all but 15 of them, and am switching from SGE to GFX. I haven’t wrapped everything yet, but that’s coming.
00:36:12.280
The problem is that SGE also provided my collision detection bitmap comparator.
00:36:19.410
But I only have 30 more seconds!
00:36:25.979
The demonstrations were just a few code snippets, so I hope you’ve enjoyed it!
00:36:33.370
The default background color is black, with the white decorators on all these slides.
00:36:40.410
I used them in all slides since I was worried about light in the room and dim projector.
00:36:47.100
But you can clear to any color! You could also blit a texture onto the background if you wanted.
00:36:52.870
I think that’s all the time we have, so thank you very much!
00:37:00.000
[Continuing background applause]