00:00:15.869
Hey, you guys ready? Thank you so much for coming. This is awesome! I was really excited when they were putting together the schedule. I said, make sure to put us down in the caves of Moria.
00:00:21.430
So, thank you all for coming down and making it. I'm Tom, and this is Yehuda.
00:00:26.890
When people told me I was signed up to do a back-to-back talk, I didn't know what I was thinking. We want to talk to you today about Skylight.
00:00:33.850
Before we dive into that, I want to talk about us a little bit. In 2011, we started a company called Tilde. It made me a little self-conscious because this is actually the first edition, and it’s printed off-center. Either I’m off-center or the shirt is; one of the two.
00:00:47.739
So, we started Tilde in 2011 after we had all just left a venture-backed company. That was a pretty traumatic experience for us because we spent a lot of time building that company, only to run out of money and sell it to Facebook. We really didn't want to repeat that experience.
00:01:06.100
When we decided to start Tilde, we wanted to be inspired by DHH and the other people at Basecamp. They talked about being bootstrapped and proud, and that message really resonated with us. However, there was one problem with being bootstrapped and proud: in order to achieve both of those things, you actually need to make money. It turns out it's not as simple as just stating it in a blog post and then being in business.
00:01:26.320
We had to think a lot about how we could make money and create a profitable and sustainable business. We didn’t want to just sell to Facebook in a few years. The most obvious suggestion people made was, 'Why don’t you just become an Ember and raise a few million dollars? What’s your business model? Mostly prayer.'
00:01:39.640
However, that’s not really how we wanted to think about building open-source communities. We don’t believe that approach necessarily leads to the best open-source communities. If you're interested in learning more about that, I recommend Leia Silber, one of our co-founders. She's giving a talk this Friday afternoon about how to build a company centered on open source.
00:01:45.130
So, no Amber game; not very much. We really wanted to build something that leveraged the strengths we believed we had: a deep knowledge of open source and the Rails stack. Also, Carl turns out is really good at building highly scalable big-data systems, with lots of Hadoop involved.
00:02:10.119
Last year at RailsConf, we announced the private beta of Skylight. How many of you have used Skylight? Can you raise your hands? Okay, many of you—awesome! Skylight is a tool for profiling and measuring the performance of your Rails applications in production.
00:02:34.690
As a product, Skylight was built on three key breakthroughs. We didn’t want to ship a product that was merely incrementally better than our competition; we wanted to deliver a product that was dramatically better—an order of magnitude better. To achieve that, we spent a lot of time thinking about how we could solve most of the problems we identified in the existing landscape. Those breakthroughs are fundamental to delivering such a product.
00:03:12.350
The first breakthrough I want to talk about is honest response times. DHH wrote a blog post on what was then the 37signals blog, now known as the Basecamp blog, titled 'The Problem with Averages.' How many of you have read it? For those who haven’t, it begins with, 'Our average response time for Basecamp right now is 87 milliseconds.' This sounds fantastic and easily leads one to believe that everything is well and there is no need to optimize performance any further. But that’s actually misleading.
00:03:24.590
The average number is skewed by many fast responses. For example, if you have 1,000 requests that return in five milliseconds, and then 200 requests take two seconds or 2,000 milliseconds, you can still report a respectable average of 170 milliseconds. However, that average is useless. DHH suggests that the solution is to use histograms. For those of you who, like me, slept through statistics class, a brief explanation: a histogram is a way to visualize the distribution of response times. You have a series of numbers along one axis, and every time you enter a number, you increment that bar by one.
00:04:07.290
This is an example of a histogram of response times in a Rails application. You can see there’s a big cluster in the middle around 488 to 500 milliseconds. It’s not the fastest app, but it’s not the worst either. You can see that as you move to the right, response times get longer, and as you move left, response times get shorter.
00:04:47.700
So why is a histogram important? It’s because most requests don’t resemble this ideal pattern. If you think about what your Rails app does, it is complex. The issue with representing one endpoint with a single number is that you lose a lot of detail to the point where, as DHH put it, it becomes useless. For example, with a histogram, you can easily identify clusters of requests, like those hitting the cache versus those that are missing it.
00:05:19.230
The other benefit of maintaining the whole distribution in the histogram is that you can check the 95th percentile—which is not the average response time but represents the average worst response time a user is likely to hit. It’s crucial to keep this in mind because customers typically generate numerous requests instead of completing their visit after just one. Therefore, one needs to be aware of the 95th percentile, as otherwise, each request is a gamble on whether they’d hit a slow response and possibly decide to close the tab and go to a competitor’s site.
00:06:16.920
Interestingly enough, that blog post by DHH was written in 2009, and after five years, there was still no tool that provided what he suggested. We caught on that there was an opportunity here—there was potential to be profitable.
00:06:38.190
However, we also discovered that building this tool was extremely challenging. We announced the private beta at RailsConf last year, and prior to that, we spent a year conducting research, creating prototypes, and finally, launching the beta. Post-RailsConf, we identified a multitude of issues and errors while building the system, and we took six months to completely rewrite the backend from the ground up.
00:07:05.070
We realized we had a bespoke problem that no one else seemed to be tackling. However, we later discovered that many of the issues we encountered had already been solved by the open-source community. We benefited tremendously from shared solutions, moving from a custom-built system to a much more standardized solution leveraging off-the-shelf open-source projects that addressed our challenges effectively.
00:07:32.460
Now, to understand how most performance monitoring tools work, think of it this way: you run your Rails app with an agent running within it. Every time the Rails app handles a request, it generates events containing performance data which are then processed by the agent and sent to a centralized server. It turns out that maintaining a running average is straightforward, which is why so many tools do it.
00:08:05.040
You would simply have to store three columns in a database: the endpoint, the running average, and the number of requests. Keeping a running average is easy from a technical standpoint but the challenge lies in how we approached it differently.
00:08:18.080
Initially, we attempted something similar where events generated by the app were sent as Active Support notifications. However, it quickly became apparent that the utility of Active Support notifications is rather limited, necessitating some normalization of the data before considering what we wanted to be upstreamed into Rails.
00:08:38.500
The downside of having every Rails app host an agent is that you end up doing a lot of redundant work and consuming a lot of memory. Given that every one of these agents is making HTTP requests, you'll have a queue of requests being sent over HTTP. While most users are accustomed to Rails apps consuming lots of memory, they are likely unaware when an agent increases that consumption by another 20 to 50 megabytes.
00:09:01.140
Consequently, we wanted to maintain the memory usage of our processes at a minimum. One of the first steps we took before last year was to extract all shared logic into a separate process called 'the coordinator.' The agent is solely responsible for collecting traces rather than managing communications with our server.
00:09:12.480
This approach allowed us to centralize all HTTP and memory-heavy logic, significantly improving efficiency. The result of this low overhead is that we can collect more information overall.
00:09:37.630
After our initial attempts, we began receiving feedback from customers, some of whom found having a separate coordinator advantageous, while others raised concerns over its memory usage. After spending a few weeks pinpointing where memory allocations came from, I discovered that tracing allocations in Ruby can be quite difficult.
00:10:04.370
It became evident that memory management in Ruby could be quite challenging, especially when simple operations like using regular expressions can have significant implications on memory performance.
00:10:16.680
At first, we contemplated using C or C++, but Carl, who is quite talented, ended up writing Rust code to manage memory efficiently without losing performance. Rust gives the benefit of writing low-level code with manual memory management without the typical dangers of segmentation faults.
00:10:41.300
By enabling our processes to run in Rust, we could maintain guarantees against common segmentation faults, which is crucial since our agents need to function seamlessly across various environments.
00:11:12.300
As for the coordinator, its purpose is to receive events—these traces that reflect what’s occurring in your application. In initial iterations, we utilized JSON to transmit the payload to our servers, but we recognized that as some users have larger requests, this could overwhelm our bandwidth.
00:11:46.290
Consequently, we decided to adopt protobufs as our transport format, resulting in substantially reduced payload sizes. While our initial prototypes for data collection were in Ruby, we transitioned to Java, achieving a remarkable performance improvement of 200 times.
00:12:12.300
Standardizing on protobufs throughout our stack has significantly enhanced efficiency. Given that modern browsers have become quite robust in their memory management capabilities, using protobufs for data transfer means we can optimize performance considerably.
00:12:30.720
The Java collector is responsible for collecting these protobufs and processing them in batches, which are then sent to a Kafka queue. Kafka functions similarly to other messaging queues, like AMQP, but offers higher throughput and fault tolerance, blending well with our processing stream.
00:12:55.680
This setup means we don’t create barriers between the data input from users and processing, allowing us to efficiently manage the requests that come in. After being queued by Kafka, those requests travel through a Storm pipeline, which essentially represents a processing pipeline in functional programming style and manages distribution, scaling, and fault tolerance internally.
00:13:29.130
As these requests undergo processing, we aim to discern elements like SQL queries and their respective durations from all incoming traces. This method of processing ensures that we can detect things like N+1 queries dynamically, and understanding the performance metrics allows us to provide optimized feedback to developers regarding their applications.
00:14:09.760
With Storm, we can establish multiple bolts to perform specific operations on the incoming request traces, such as aggregating averages or identifying anomalies in usage patterns. By having this structure in place, we are equipped to analyze data effectively and provide developers with actionable insights while eliminating concerns around fault tolerance.
00:14:49.130
Once this processing is complete, we store the data in Cassandra, an optimal database for our use case. While Cassandra may lack certain intricate functionalities of more advanced databases, its capacity for high volume write operations aligns well with our needs.
00:15:36.100
Cassandra allows us to manage significant volumes of data as we process requests. Once we finish processing a batch, we implement roll-ups, aggregating data every minute, every 10 minutes, and every hour to ensure we maintain clarity regarding application performance over time.
00:16:05.810
By segmenting the data collections, we hope to maintain high granularity during initial analysis while providing day-long or hour-long aggregates for retrospective evaluations. The architecture we have developed involved significant effort; Karl dedicated nearly six months to studying PhD theses while exploring data structures and algorithms to manage such large-scale data effectively.
00:16:46.920
Months after we entered the private beta, we were already handling over a billion requests each month across all our customers. As our infrastructure grew, we needed solutions to manage an overwhelming amount of data efficiently without sacrificing availability or speed.
00:17:34.770
For transparency and high-quality insights, we decided against traditional methods of storing large datasets while attempting to query them post-facto. Instead, we focused on maintaining a real-time feedback loop through efficient storage systems and processing methods.
00:18:11.580
To make our tool truly valuable, we emphasized the user experience while also ensuring our technical foundation was solid. To achieve this, we employed Ember for our UI, resulting in significant enhancements to user interactivity and feedback speeds, allowing developers to easily navigate our insights.
00:18:43.760
Pairing Ember with D3 has enabled us to create compelling visualizations to represent performance data interactively. Our goal was to provide swift feedback so that any insights could prompt further exploration without laborious delays.
00:19:20.430
The interactivity in our UI illustrates how responsive our architecture is, where data retrieval is fast and efficient, allowing users to manipulate their queries and view results in real-time. This capability to make quick adjustments emphasizes an intuitive design that promotes a smoother experience.
00:20:17.430
The key breakthroughs we introduced in developing Skylight focus on honest response times, analytical clarity, and an effective user interface that fosters engagement. By approaching performance monitoring differently than historical tools, we positioned Skylight to succeed in a competitive landscape.
00:20:29.930
Our vision for Skylight is to act as a smart profiler that operates in production, not just locally, which allows us to mirror the realities of performance for users. To provide a practical demonstration of Skylight, let me take you through its main interface.
00:21:08.370
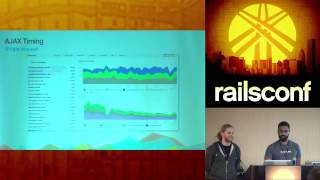
Here you can see the Skylight dashboard. It illustrates various performance metrics, including a graph representing the 95th percentile of response times. On the right side, there’s a graph detailing requests per minute, giving a live overview of your application’s current performance.
00:21:45.090
As you examine the data, a breakdown of endpoints is presented below, allowing you to identify which parts of your application require optimization. By tapping into the details of specific requests, you can gain insights into response times and understand where optimization opportunities lie within your application.
00:22:24.540
The comprehensive data analytics functionalities are designed not only for fast access to real-time metrics but also for historical data analysis. Through intuitive interactions, users can zoom into specific timeframes to detect patterns and performance anomalies.
00:23:05.580
The histogram visualizations within Skylight further enhance performance analysis by illustrating frequency distributions of response times, allowing you to identify fast and slow request patterns quickly. Moreover, the aggregate trace feature provides averaged insights for analyzing the overall performance landscape.
00:23:40.470
The UI's responsive components, powered by D3, refresh in real-time, guaranteeing a seamless experience as users adjust their views. While this interface is powerful, we need to ensure that user engagement remains high while also presenting valuable information clearly.
00:24:18.900
The discoveries we make through Skylight can help pinpoint bottlenecks within Rails applications, addressing issues like N +1 queries dynamically. In future iterations, plans will focus on enhancing our detection systems to automatically flag performance issues, making it easier for developers to optimize their applications effectively.
00:25:07.050
Ultimately, Skylight provides insights into performance status without overwhelming users with sifting through raw data. We pivoted from being merely data providers to offering actionable insights so developers can promptly address performance issues without deciphering raw metrics.
00:25:50.460
Besides focusing on performance analytics, Skylight features a user-friendly interface that permits intuitive interactions and visual insights. The considerable speed and responsiveness we’ve built into this system promote a pleasant experience that encourages exploration of site data without discouragement.
00:26:27.020
Utilizing Ruby 2.1's stack sampling capabilities, we can obtain detailed visibility into code performance in real-time, making it possible to gain insights that weren’t previously achievable in production environments. This integration with Ruby allows us to collect rich profiling data without significant overhead on your application.
00:27:05.580
Furthermore, as we continue to refine and innovate, we anticipate backporting these capabilities to earlier Ruby versions. The innovations we are implementing can lead to substantial performance breakthroughs for users actively working on Rails applications.
00:27:43.500
If you're interested in exploring Skylight further, we’d love for you to give it a try. It’s available now without the need for invitation tokens, and you can sign up for a 30-day free trial if you haven't already.
00:28:16.150
Should you have any questions, feel free to reach out to us directly or visit our booth in the vendor hall. Thank you all very much!
00:28:37.270
Oh.


