00:00:25.519
Hello everyone, I'm Joseph Ruscio, co-founder and CTO of a company called Librato. We specialize in monitoring, and I personally have a great passion for graphs. Today, I'll be discussing the topic: 'It's not in production unless it's monitored,' which is one of my favorite quotes.
00:00:31.439
I wanted to find out the origin of this quote and, as best as I can tell, it was spoken by Greg, a DevOps engineer at Evite. It's interesting to note that Evite is one of the older web 1.0 properties, launched in 1998, and they've sent out over a billion invitations. When Greg shared this on Twitter about a year and a half ago, Evite had just completed a significant overhaul of their system, moving from Java and Oracle Rack to Python, Google App Engine, and various polyglot NoSQL solutions.
00:00:49.360
This shift got me thinking about the context of their transition as they prepared for the next decade. If you consider how SaaS was developed approximately ten to fourteen years ago, you would start by securing a seed round of funding, generally in the millions of dollars. That funding was necessary as the initial capital expenses for purchasing servers were substantial, coupled with the need for a dedicated operations team to manage them and ultimately build your own custom software stack.
00:01:07.360
In 2012, however, the landscape looks quite different. Nowadays, if you're securing a seed round, it might even be as little as twenty thousand dollars. Your infrastructure expenses are billed monthly, similar to your cable bill as you leverage services like Amazon or Rackspace. If you have an ops person, it's often just one, and you’re using open-source software and external services to build your entire stack.
00:01:27.920
This transformation means that our infrastructure is now much more agile. This agility allows for rapid adaptation to change, as servers and instances can easily come and go. When you talk with Amazon, they'll tell you that you must operate across multiple availability zones because they reserve the right to take your servers away at any time.
00:01:47.360
Currently, we experience more change with worse tools. Google provides outstanding tools for monitoring within their own infrastructure, but they don’t help you much elsewhere. Consequently, this situation is leading to a renaissance in monitoring among leading companies like Etsy, Flickr, and GitHub. One common thread driving these companies towards highly effective monitoring solutions is their adoption of continuous deployment.
00:02:18.720
Now, I’d like to see a show of hands: how many of you practice continuous deployment? That’s quite a few, which is encouraging. Here's an interesting tidbit: while it's easy to get caught up in the narrative that shipping often replaces the need for large-scale releases, the flip side is that once you establish a routine of shipping once a week or every two weeks, it tends to create a day where everyone scrambles to make it happen.
00:02:49.520
This practice can lead to a false economy; the time spent preparing for deployments becomes a trade-off between wasting time on scheduled releases versus addressing features that may not even be necessary. At our organization, we implement continuous deployment through a five-step process, beginning with continuous integration.
00:03:15.200
Continuous integration means that as developers, we run tests consistently to ensure that every push of new code doesn’t break any functionality. The goal is to make deployments as inexpensive as possible. This process might involve utilizing a Campfire bot or a single-click solution, ensuring that every deployment is seamless.
00:03:44.239
Once the code is deployed, we employ feature flagging to gradually roll out new features to a subset of users before a full deployment. However, even with this robust setup, problems can still slip through, which is where monitoring comes into play. The importance of monitoring and instrumentation for operations is akin to the role of unit tests in development.
00:04:03.760
Having good monitoring allows operations teams to sleep soundly, confident that if an issue arises post-deployment, they can quickly identify and address it. Active monitoring is crucial, as it provides immediate feedback on system health right after a deployment. However, it is essential to also address latent bugs by implementing effective alerting mechanisms.
00:04:36.480
For instance, Travis CI, a popular continuous integration tool, recently shared insights on monitoring. They illustrated their process during a deployment where they tracked error responses. Following a spike in errors, their team rapidly deployed a fix and regularly examined the metrics to monitor their progress and recovery. This immediate feedback loop is vital.
00:05:04.160
As a humorous note, I've found that monitoring can occasionally lead to unexpected discoveries, like the infamous 'chunky bacon' phenomenon, which illustrates that monitoring can also lead to interesting and unexpected insights. When considering monitoring tools, the options can be overwhelming – there are numerous services available.
00:05:50.760
In my view, some tools stand out as particularly effective, while others fall short. The hope is to empower the audience to discern the best options available after this talk. However, those who rely on less effective tools may end up with a fragmented monitoring strategy where siloed systems make it difficult to gather cohesive insights.
00:06:13.040
There is indeed a prevalent frustration with monitoring systems when they become overly complicated, featuring cumbersome configurations that don't adequately serve the need for flexibility. Moreover, monitoring should not be an exercise in configuration fatigue, and many solutions are ill-suited to dynamic infrastructures that rely on ephemeral application instances.
00:06:42.559
This points to a growing movement within the DevOps community dedicated to improving monitoring practices. We need to develop better monitoring frameworks that enable us to evaluate and implement solutions efficiently. A key area to focus on is the type of metrics you choose to track.
00:07:05.280
Business drivers are crucial metrics to monitor. These might seem minor, but they're vital; they directly influence revenue and ensure the sustainability of your business. Alongside business drivers, application performance must also be considered as it impacts customer experience. Additionally, monitoring system resources and network performance provides a holistic understanding of application health.
00:07:36.480
To effectively monitor these metrics, it's crucial to have the ability to cross-check within the stack. For example, if your business model is volume-based, closely tracking API call frequency is key, as this number is interlinked with application performance, resource usage, and network activity.
00:08:06.480
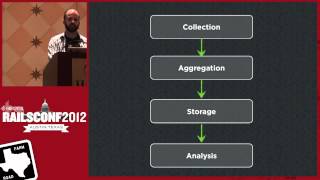
When using monolithic solutions, the internal architecture generally comprises a collection stage, aggregation, and storage. Each request generates a measurement that occurs within milliseconds. However, due to the sheer volume of data generated, immediate storage becomes impractical, necessitating an aggregation phase that can roll up data into manageable intervals.
00:08:38.400
As a service operator, it is critical to recognize the diagram defining the stages of monitoring. This raises questions about how we can effectively separate concerns within monitoring processes and create defined interfaces that allow for better configuration and management of data flows.
00:09:08.159
The most critical aspect to address is the cost of data collection. If monitoring becomes too burdensome, it leads to decreased adoption; consequently, we must strive to make the collection process as efficient as possible. Just like fluent developers integrate tests into their workflows, we should strive to integrate monitoring seamlessly into our code deployment.
00:09:46.399
One of the simplest and most cost-effective methods to monitor your applications is through logging. There are several intriguing projects to explore, such as Etsy's Logster, which helps in parsing and analyzing log files for insights. By treating logs as streams of semi-structured text, you can extract valuable statistical data.
00:10:21.040
Together with tools such as Logstash, which functions similarly to syslog, you can monitor application performance effectively. Additionally, leveraging services like Papertrail provides logging management solutions that can integrate with third-party tools for enhanced visualization.
00:10:42.560
ActiveSupport::Notifications in Rails is also a fantastic mechanism to effortlessly instrument performance. It offers numerous out-of-the-box options to integrate monitoring into Rails applications efficiently. Projects such as Metrics provide straightforward primitives like counters and timers, streamlining data collection and reporting.
00:11:17.120
Moving beyond the collection phase, aggregation of collected data is key to managing performance insights effectively. StatsD, a highly effective tool from Etsy, allows for real-time data collection with very minimal overhead. By deploying StatsD, you can capture metrics quickly with very little impact on application performance.
00:12:02.080
An attractive aspect of StatsD is its lightweight architecture, making it versatile for use across many different environments. Numerous client libraries exist that support StatD integration, which allows for extensive customization in how you implement monitoring across your services.
00:12:34.720
In addition to collection and aggregation, centralization of monitored data adds significant value. This enables you to perform analyses and correlation across datasources. Leveraging a robust storage solution becomes essential; you can utilize round-robin databases or alternatives like Graphite for storing your metrics efficiently.
00:13:11.680
Graphite presents an excellent option as it bundles metric storage with visualization, allowing seamless interpretation of collected data. It supports multiple metrics and provides built-in graph generation, making it a popular choice among monitoring solutions. Ensuring sufficient data retention and managing effective storage solutions is a critical factor for scaling.
00:13:48.799
Another modern approach to monitoring is the use of open time series databases, which utilize scalable architectures such as Hadoop to handle large datasets across multi-dimensional contexts. This flexibility allows for more nuanced data analyses and insights tailored to your specific applications.
00:14:27.200
Considering a centralized monitoring strategy, visualize your data collection with the ability to correlate metrics will dramatically improve incident response and capability to identify issues. Annotations for critical events such as deployments can be embedded within visualization tools to provide context, allowing for enhanced visibility and improved operational awareness.
00:15:11.920
You should not underestimate the power of dashboards in your monitoring toolkit. Dashboards provide stakeholders with shared insights that are crucial for making informed decisions, fostering a culture of transparency. From performance optimization to error alerts, having accessible dashboards can dramatically increase engagement.
00:15:54.720
Ultimately, accessible dashboards allow teams to synchronize efforts and ensure alignment. Monitoring data can also help facilitate discussions across organizational levels, promoting cohesion. Furthermore, consider the significant role of alerts in ensuring responsiveness to system anomalies. Notifications should be both actionable and tailored to specific thresholds.
00:16:39.760
Establish a strategy to tune alerts continually so they remain relevant. The goal of any alerting strategy is to eliminate noise while simultaneously providing essential insights. Integration with third-party services can significantly enhance your alerting capabilities, ensuring timely communication regarding potential issues.
00:17:30.240
In conclusion, as we consider all the points we’ve discussed, it's paramount that monitoring is approached as an integral part of both operational practices and development cycles. By focusing on separation of concerns, effective tooling, and conscious alert management, we can build robust monitoring systems that support our applications and teams.
00:18:09.760
In closing, remember, good monitoring practices not only aid in maintaining operational awareness but are essential for understanding user experience and business health. Thank you all for your attention, and I'm looking forward to any questions you might have.


