00:00:15.680
I'm glad I gave her my less embarrassing bow. Does anyone else think it's inappropriate that we're having a Ruby track inside the Crystal Ballroom?
00:00:38.280
My talk is called "Pointers for Eliminating Heaps of Memory," and yes, there will be C code in this talk. This is a pun in case there is any question about that. But first, I want to talk a little bit about Ruby's standard library.
00:00:51.510
There is a library you can install called 'standard.' It is Ruby's standard library. If you were at the game show yesterday, we discussed the most popular gems, and I want to make Ruby's standard library one of the most popular gems. Basically, what this gem is, is an opinionated implementation of RuboCop, so you can't configure it at all. You install it and use it like RuboCop, but you cannot change anything. Those are the correct rules, so go ahead and download Ruby's new standard library today.
00:01:16.860
My name is Aaron Patterson, and you may know me on the Internet as Tenderlove. If you don't recognize me in a burger hat, this is what I look like online; it's a little different. I have two cats: Gorbachev, Puff Puff, Thunderhorse, and the other cat is named Sea-Tac Airport, or as we call her, Tutu for short. I have stickers of my cats, so if you want to come talk to me, please come say hello, and I will give you a sticker if you want one. You don’t have to take one, but I have them anyway.
00:02:07.110
I work for a very small startup company called GitHub. We were recently acquired by a very large company, so I had to change my desktop background to stay on brand. GitHub is the first legit company I've ever worked for, and I love using Git, but I will not force push it on you. Now, your pain feeds me; know this. My acquisition by Microsoft has really given me a chance to branch out, and as I said, it's opened a lot of windows for me.
00:03:10.890
Oh, thanks, Shane! An important lesson that I have learned is to not airdrop the people who are speaking. That's exactly what is happening to me right now! Just yesterday, I received my Microsoft email address, and I'm really excited about it. I want to share my email with you. Please, seriously, this is my email: send me many emails! But much like my regular email accounts, this will go into an inbox that I do not read.
00:03:37.910
Please email me here! I will check it when I figure out how to use it, and I hope that your emails will help give me a better outlook on life. All right, so now let's get to the real technical content. I hope that you'll enjoy this talk; I'm going to make many PowerPoints.
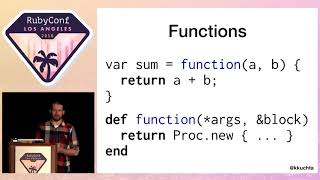
00:04:11.720
Actually, Comic Sans and Times New Roman are the only fonts I'm allowed to use. All right, let's get to the actual content here. So I'm going to talk about reducing memory usage in Ruby. Specifically, I'm going to discuss two optimizations that I wrote for Ruby 2.6. We're going to go through the patches I wrote, how I came up with those patches, and what tools I used, and how you can do the same type of thing.
00:04:57.569
The first patch I'm going to talk about is the patch for the loaded features cache. I'll talk about that later. The second patch I'll discuss is what I call 'direct I seek marking.' 'I seek' stands for instruction sequence. But before we can talk about reducing memory usage, we have to find what memory to reduce.
00:05:19.030
The first thing I want to talk about is actually finding memory usage in your application. Now, the patches that I wrote... well, Ruby is written in C, and MRI is written in C, so a lot of the heap analysis that I do has to do with the C programming language. We're going to discuss techniques for finding memory usage in C programs.
00:06:02.800
There are two main techniques that I use. The first one is a very bad technique, and it is called 'reading the code.' This technique is inefficient and does not always work, but it is a technique that I sometimes have to use. The other technique that I like to use is called 'malloc stack tracing.' I'll talk about how to use that in a minute.
00:06:44.410
With Ruby programs, we need to consider two different places where we allocate memory: one is in the garbage collector, and the other is from malloc. We allocate Ruby objects using Ruby's garbage collector, and we allocate strings and other items using the system's malloc. We have many tools for profiling objects allocated in the GC, like ObjectSpace and the Allocation Tracer gem. You can use these two, and I encourage you to look them up, but I'm not going to talk about them today.
00:07:20.679
These tools are great for profiling Ruby object allocations but aren't very good at profiling malloc allocations. So, we'll look at how to find malloc-based allocations, and the technique I use is called malloc stack logging. This is a tool that's available on OS X, but there are other tools available on Linux and other operating systems as well.
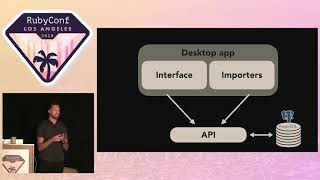
00:07:43.779
You use malloc stack logging by setting an environment variable that says you want to log all malloc calls. Here is what I'm doing: I'm starting up a Rails application, printing out the PID of the Rails app. I have labels for these operations.
00:08:07.389
We enable the logger, print out the PID, clean up any garbage, and then pause the process. The reason we have to pause the process is that macOS uses address randomization. This means every time you run your program, memory gets allocated into different addresses. So, in order to know which addresses map to what, we need to pause the program and profile it while it's running. This simply pauses the program, allowing us to run the logging in one terminal and, in another terminal, take the printed PID and run 'malloc history' with it to write everything to a log file.
00:08:47.589
What this will do is log every time malloc or free was called, along with the stack trace for that malloc and free. Now, you need to have a lot of space available on your hard drive because this is profiling a very basic Rails application. In fact, the log file generated was about 6.2 gigs, so you need free space if you plan to do this on your actual app.
00:09:24.269
The file contents look like this: it consists of one line for each malloc and free, showing the memory location of each allocation, its size, and the stack trace. For the free operations, we can see which address was freed and the stack trace for that particular free. Given this information, we can reconcile live memory in the system.
00:09:48.650
This is a simple program to reconcile mallocs and frees. First, we know how much memory the program was using at any point in time before we paused it. Second, we can determine what allocations are using the most memory and how much was allocated at the time we paused the program.
00:10:04.190
However, when you look at these stack traces, you'll see that the top entry is either malloc or free, and we don't care so much about those. We actually want to know who is calling malloc, as those are the places we want to target in our code. Adjusting the previous program slightly, instead of logging which malloc we have, we take a look at the caller of malloc so we know where to look in our profile.
00:10:30.679
To give you an idea of what this looks like, here's a pie chart of the top allocators in Ruby when booting up a Rails application. These represent the top callers of malloc. After doing a process like this, I combine this technique with reading the code; I examine the functions allocating a large amount of memory and find ways to reduce memory usage.
00:10:55.610
Now, let's take a look at the loaded features cache. This is the first patch I introduced. The loaded features cache patch I wrote takes advantage of a technique called shared string optimization.
00:11:04.980
I'll teach you about shared string optimization, and then we'll look at the patch. Essentially, Ruby strings allow us to share the same underlying C buffer. Every Ruby string is backed by a char star buffer in C. We have three Ruby objects, all being represented by the same underlying C string buffer. For example, we have 'X' pointing at the head of the string, 'A' is a duplicate that also points to the head, and 'B' is a substring that starts at the next character to the end.
00:11:50.230
We can share strings like this if we're looking at some points along the string, but we can't share when taking a substring that does not go to the end. The reason is Ruby's underlying C buffers have to be null-terminated, so we can't copy parts in the middle. Our shared string rule is to always copy to the end of the string if possible. That way, we can represent more than one Ruby string using the same underlying buffer.
00:12:13.700
Now, what does this have to do with loaded features? Loaded features is a global variable that keeps track of every file required in your Ruby program. If you require 'foo', you'll see a new string added to that array. This array acts as a database to determine if a file has been required. Unfortunately, there’s a complication regarding how Ruby recognizes the same file.
00:12:47.920
For instance, here’s a program where we require the same file, but the parameters differ each time we call require. This is an extreme example, and we expect Ruby to execute that file only once. This means that Ruby has to look up whether it has been required before by searching through the loaded features array. The problem is that array searches are slow. We want to avoid searching the array every time we invoke require.
00:13:29.790
To speed this up, Ruby creates a hash caching every possible parameter that can be passed to require. For instance, if we require 'abc.rb', it creates a cache of keys that may map to the same file. Now, when require is called again, we can quickly check if we’ve seen that key before and if so, just skip to the next step.
00:14:02.990
The actual key cache structure looks like this: each of those keys maps to the array index of the file we required. So when we require a file, we can look it up, check the array, and see what was required. If we have this cache, we avoid unnecessary calls to require, speeding up our applications significantly.
00:14:43.050
The way we generate this cache is written in C, but I’ve translated it into Ruby for this presentation because, after all, it's a Ruby conference. The algorithm works by placing two pointers at the ends of the string buffer. One pointer moves back to the first period, while the other moves back to the first slash. Then we take the keys between the pointers until we reach the beginning of the string and generate the full cache.
00:15:32.920
The challenge with this cache key generation is that it uses substrings of the original string. Using Ruby's substring function when the substrings do not cover the entire original string requires making copies. While some Ruby objects point at the original buffer, copies require additional malloc allocations. Our first optimization is to reduce these allocations.
00:16:01.380
We can reduce the number of mallocs by applying this shared string optimization and only copying the string once. Now, when we take substrings, we can share buffers between multiple objects, significantly cutting the number of malloc calls. The cache is implemented solely in C and isn’t directly exposed to Ruby users.
00:17:30.740
Today, in Ruby 2.5, our cache has a hash pointing to several Ruby objects, which essentially point to underlying string buffers. Since we don't need to expose the Ruby objects, we can let the hash point directly to strings instead. As a result, we eliminate all those additional object allocations.
00:18:00.090
This brings us down to only two malloc calls from five, illustrating the efficiency of this change. This patch was designed to see the impact using allocation tracer. When requiring a long file, we expected to see fewer string allocations in Ruby 2.6 compared to 2.5, potentially reducing those by about 50% in certain applications.
00:18:54.020
This reduction does not mean a straight 50% decrease in allocations in programs overall, as it varies with how many files you require. In our use case at work, we require a lot of files, so I expect it would have a significant positive impact on memory management.
00:19:43.100
After finishing the patch, I was very proud of myself. I debugged the code, wrote the patch, ensured it worked, and made some nice graphs. I submitted a bug report and happily posted the patch when I received a comment from a fellow Ruby developer named Funny Falcon.
00:20:27.130
He alerted me that he had found the same problem I was addressing and had submitted a patch as well, but his patch was submitted five years ago and had not been applied. So, I took the initiative to apply his patch together with mine.
00:21:15.400
The takeaway from this experience is to always search before you start a new implementation. Funny Falcon is now a Ruby committer, so he has the ability to apply such patches himself!
00:21:29.080
Now, let’s move on to the next patch, which I call direct I seek instruction sequence marking. This technique requires an understanding of how Ruby's virtual machine operates, so I'll explain Ruby's VM. Ruby is a stack-based virtual machine, meaning it maintains a list of instructions and a stack for executing those instructions.
00:22:49.030
Commands are structured in a list where each instruction is an array with its operation and operands. The VM maintains a program counter (PC) that points to the next instruction to execute and increments after each execution to point to the following one. For instance, upon executing commands to push integers onto the stack, the summed value is also pushed back on the stack.
00:23:43.370
Your Ruby programs undergo compilation before they run; they are compiled into bytecode that evolves through several processing phases. Initially, source code is transformed into an abstract syntax tree (AST), then into a linked list, and finally into bytecode. The linked list is where optimizations are applied, by removing dead code amongst other improvements, before the final structure is translated into bytecode.
00:24:43.440
Bytecode consists of binary code executed by the VM, effectively represented as a list of integers. When translating the linked list nodes into integers, you would see data structures referenced in the bytecode instead of actual objects. With this understanding, let's explore the implications for memory management.
00:25:34.620
When Ruby parses a program with string literals, it allocates Ruby string objects stored in the AST. Once we convert the AST into linked lists, the push operations include these Ruby objects. However, when translating the bytecode back, we need to reference the addresses of these Ruby objects. In a linked list, the strategy focuses on using object addresses rather than actual objects.
00:26:34.720
When calling the VM, it handles pointers that exist only in C. For our simple bytecode example, we will embed the string representations. As we execute the created bytecode, we inadvertently see the same objects allocated multiple times impacting our memory significantly.
00:27:36.700
When invoking the append instruction, a destructive operation modifies the stack objects while impacting object sequence as well. To resolve this behavior, we need to copy the object before pushing it onto the stack. After implementing this modification, we can push copies instead of originals, thus preventing unintended mutations on subsequent executions.
00:28:36.900
In terms of object allocations, compile-time counts two strings while runtime allocations add strings due to duplication. Moreover, the frozen string literal optimization aids our scenario by allowing us to avoid duplication on the stack with mutatable strings, preserving original string literals.
00:29:51.700
Understanding the VM and the frozen literal optimization equips us to appreciate how the direct I seek marking optimization can assist us. 'I seek' essentially points at a list of integers representing the bytecode, while the objects in that list require management by the garbage collector.
00:30:57.720
With 'I seek' pointing to string objects that could become garbage collected, we have to ensure these objects remain intact during program execution. The prior method utilized a mark array that references all objects to sustain them during garbage collection—this resulted in redundancy.
00:31:55.550
The issue with this method is that it leads to array bloat. Adding an object to an array increases its capacity significantly, causing excess elements that reside unused unless plenty of objects are added. In structuring an instruction sequence to work indefinitely leads to significant waste as it never reclaims this space.
00:32:55.040
To minimize array bloat, we can dynamically resize arrays as we compile. Alternatively, we can potentially eliminate arrays entirely by providing a decoding program for instructions that directly marks objects when found.
00:34:13.150
This method simplifies marking objects directly on the VM to remove the array altogether. Implementing this strategy led to a notable reduction in Ruby array allocations during boot times in basic Rails applications. Ruby 2.5 allocated approximately 35,000 arrays, while Ruby 2.6 sees a reduction to roughly 8,500 arrays—an overall 34% reduction in boot time objects.
00:35:33.699
In essence, we accomplished a 6% reduction in overall memory usage, contingent upon your Ruby applications' code loading. The results vary based on the frequency of file requirements within your applications.
00:36:26.450
How much would you be willing to pay for these improvements? A hundred dollars? A thousand? You can have these benefits today by upgrading to Ruby 2.6.
00:37:12.170
In conclusion, throughout this talk, we learned about virtual machines, memory management, and much more about Ruby programming techniques. Thank you very much for your attention!