00:00:15.740
I'm really glad that you're able to join me today. Before we begin the talk, might I request you to please put your phones on silent so that others can enjoy it as well?
00:00:27.060
Now, since it's the first session after the keynote, let's talk Ruby. What are the good qualities of Ruby? Well, you have the purity, you've got the polish, and the refractive index, of course.
00:00:42.450
Now, if you chuckled at that, then you’ll love the joke I’m going to make. But seriously, the topic for the day is RubyPlot: creating a plotting library in Ruby.
00:00:54.510
We won't be coding a lot along, so if you'd like to, you can turn off your laptops. But who is this talk for? Let's take a quick survey. How many amateur Rubyists are in the house? Good. How many Ruby veterans? Awesome!
00:01:13.260
Have you guys heard of this language named Python and its plotting library Matplotlib? It's a small sorting library, quite famous. Any Matplotlib users in the audience? A few, I see. But are these not total users, only using Matplotlib? Cool!
00:01:27.840
Now, how many of you like really bad jokes? Cool! So this presentation is virtually for everyone. Now, you must be thinking, 'Who the hell is this loud guy on the podium?' Well, that was a trick question, and the correct answer is none of the above, though my mom says I’m a genius.
00:01:51.000
But let me introduce myself. Hi, I’m Pranav Garg, a senior undergraduate student from BITS Pilani, India. I am a mature Rubyist and aspiring researcher in the field of theoretical neuroscience and its conjunction with reinforcement learning.
00:02:19.110
Finally, over the summer, I started working on a plotting library from scratch at SCI Ruby as part of Google Summer of Code. And there's a word of warning over here, so please don't judge me.
00:02:39.540
Now, let's go through a quick plan for the talk. Firstly, we have the introduction, which is still ongoing. Then we'll discuss the general plotting library architecture, which is going to be modular, allowing you different degrees of control.
00:03:11.610
We'll be talking about my journey in the creation of RubyPlot, followed by some general thoughts such as why you should use Ruby for scientific software, and a crazy idea called language-independent scientific software.
00:03:30.030
Finally, at the risk of sounding like a snake oil salesman, I’ve got a brilliant opportunity just for you. We will have a Q&A session, but it's going to be informal and after the talk, so you can catch me around or tweet at me anytime.
00:03:44.549
Now, let’s begin with the plotting library architecture. Since I want to drink some water, here are the sub-points that we will be going through. I will read them out, and you can see them for 10 seconds. You know what? I’m not patient, so let’s make it 3 seconds.
00:04:06.870
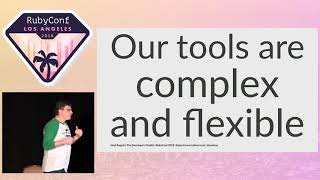
So, what are the qualities of a good plotting library? Firstly, it should adapt to the needs of its user. You could be a high-level user who simply wants a good bar plot: you just want to provide an array of values and have a bar plot created without defining every single pixel.
00:04:40.620
On the other hand, you might be a genius who wants to define a new plot altogether. These represent the different layers of control we wish to have in the library.
00:05:06.120
This brings us to the second point: it should be modular. By modular, I don’t just mean different degrees of control but that there should be different back ends that are easily swappable.
00:05:41.580
Finally, it should be dynamic. What do we mean by static versus dynamic plotting libraries? We will get into that, but know that whenever I talk about a plotting library, I will be referring to a scientific plotting library.
00:06:06.630
What is the difference? Well, a scientific plotting library is meant to handle a lot of data and has to be easily adaptable. When we talk about plotting libraries, Matplotlib is one of the best examples.
00:06:34.410
It was the brainchild of the late Dr. John D. Hunter and, like any other open-source software, it has undergone many iterations. In fact, while I was looking through its source code, I found a comment indicating old code paths that had become deprecated, revealing just how much maturity the architecture of Matplotlib has gone through.
00:07:18.180
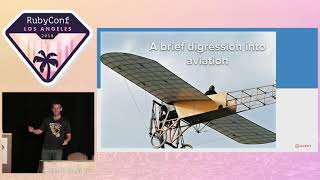
In RubyPlot, we took the Matplotlib architecture and adapted it specifically to Ruby. I like to share the lovely story about its creation, which began as a reaction to the paid license of MATLAB.
00:07:50.449
John Hunter, a neuroscientist, faced a similar predicament with only one MATLAB license in his lab. Like any ordinary person, he created his own plotting library that would later be used by millions.
00:08:14.100
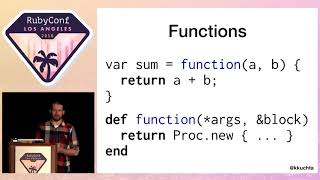
Now, let’s discuss the various degrees of abstraction. There are three layers: the backend layer, the artist layer, and the frontend API or scripting layer. Think of it as a cake: you have the backend at the base, the artist layer in between, and finally the scripting layer.
00:08:59.130
I have a better analogy for you. Have you guys seen the movie Ratatouille? Awesome! For those who haven’t, the movie features a garbage boy named Linguini, who becomes a chef with the help of a mouse.
00:09:19.890
In our case, Linguini is the artist, and the backend layer represents the canvas and paint he uses to create masterpieces.
00:09:48.090
The canvas is where you draw the image, which could be a PNG file or maybe a GTK window. The renderer is the paint you use, and importantly, there are two types of renderers: vector graphics and raster graphics. Raster graphics involve a collection of pixels, while vector graphics consist of paths and lines, allowing scalability without losing quality.
00:10:23.940
Finally, there is a secret ingredient to all this. Let’s move on to the artist layer. This layer has a class known as 'Axes' and contains a transformation layer to handle simple scaling of coordinates.
00:10:43.670
For example, given an image, I need to scale it down from 0 to 1 using simple linear algebra. This transformation layer is crucial for making the library dynamic. The 'Axes' represent the standard x and y axes with ticks and legends.
00:11:17.220
The front-end API, which I like to refer to as the scripting layer, is meant for users who want to create simple graphs without needing to manage all details.
00:11:54.480
A static plotting library is exemplified by a simple PNG image, which you cannot interact with. To make a static image dynamic, you need to have interaction capabilities, enabling user input to modify the visualizations.
00:12:27.180
An interesting story from my high school days is relevant here. I created a game called Snake, which had to appear animated while its tail got shorter. I refreshed the screen each frame, merely updating what was drawn. This concept of refreshing will also apply in making dynamic libraries.
00:12:54.960
Now, regarding the secret ingredient we discussed, there are actually two: an electronics engineer’s feedback loop and good event handling.
00:13:19.860
To facilitate better interactions, we integrate the GUI library with event handlers that communicate with the transformation layer, allowing dynamic updates based on user interactions without replotting everything from scratch.
00:13:58.620
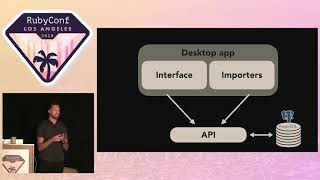
Let’s talk about the grand design. The front-end layer directs commands to the transformation layer, which processes them and passes the information to the backend, rendering it all into a cohesive dynamic experience.
00:14:23.840
Now, let’s discuss the making of RubyPlot. Initially, my talk aimed to promote the library I worked on and share its architecture, but I've realized the main objective should be encouraging more people to work on open-source scientific software.
00:14:50.050
During its development, we decided to create a Ruby wrapper around the gr framework while integrating it with other essential components. I partnered with others in the community, which helped broaden the scope and capabilities of the project.
00:15:13.550
I initially explored various methods such as FFI and C extensions before landing on C extensions as the most reliable, albeit challenging, solution.
00:15:41.680
Our biggest challenge was handling plotting space effectively. We developed solutions to instantiate data classes dynamically, allowing automated plotting while ensuring proper axis scaling and data display.
00:16:01.800
The final challenge involved managing subplots, ensuring that when new figures or subplots were created, they would be accurately recognized and rendered.
00:16:20.010
Through perseverance, we succeeded in building a robust and flexible plotting library capable of accommodating various scientific plotting needs.
00:16:46.890
In summary, as we look towards the future of RubyPlot, our aim is to elaborate on the existing frameworks and encourage developers to contribute, making Ruby a viable alternative for scientific computation.
00:17:03.570
I encourage developers to explore Ruby as a language for scientific computing, arguing that its features make it suitable compared to Python, especially with its expressive syntax and metaprogramming capabilities.
00:17:43.570
Additionally, I discussed the potential for developing language-independent scientific software, emphasizing the importance of community-driven open-source projects.
00:18:07.460
In conclusion, I urge our audience to participate in collaborative efforts within the Ruby community, to build quality libraries and contribute to scientific software solutions.
00:18:23.570
Special thanks to my mentors and organizing bodies who contributed to the success of this initiative. I'm eager to connect with more developers and research participants to explore further opportunities.
00:18:49.350
Thank you so much for your attention! I look forward to engaging with you through questions and discussions.