00:00:00.240
Welcome to our presentation.
00:00:16.680
Thank you all for coming out today. This is both Vince's and my first time speaking at RailsConf. In fact, this is my first experience as a developer speaking at any event, so it’s a really exciting opportunity for me. We are both humbled that you could join us. Since you had to come all the way down to the caves to find us, I hope you brought your jackets because it's quite chilly in here.
00:00:34.559
My name is Shiv, and I am a software engineer at New Relic. I work on a team we refer to as the business enablement team, which is our internal engineering team that serves various business units within the company. During this presentation, I will provide a couple of examples of what that means. And this is Vince; he works on the RPM UI that you are all hopefully familiar with.
00:00:58.559
Vince primarily focuses on more infrastructure and back-end tasks these days. He has been with New Relic for about a year. I remember last year at RailsConf in Portland, Vince was interviewing with us, making this a nice anniversary for him.
00:01:13.620
To get a quick sense of our audience, I would like to ask for a raise of hands. Firstly, how many here have heard of New Relic before? Great! Please keep your hands raised. Now, how many of you are currently using New Relic, either as a side project or in a production application?
00:01:38.220
Keep your hands raised if you are using it specifically in a production application currently. Fantastic! Now, keep your hands up if you have checked New Relic in the last seven days. That’s encouraging to see; thank you! You can take your hands down now.
00:02:05.939
Next, how many of you would identify yourselves as software engineers? Most of you. How about software writers or business persons—those who consider themselves more business-oriented? Perhaps a blend of the two? A lot of you; that’s cool!
00:02:24.900
The purpose of this presentation is to explore the concept of software analytics and how it can relate to making informed business decisions. Regardless of what software analytics tool you choose, it seems many of you have utilized New Relic before. The key takeaway we want to convey is that software analytics can significantly inform your business decisions.
00:02:40.740
Throughout this presentation, we will begin with a product overview, which Vince will walk through. As we’re in a sponsored event, we will be discussing New Relic. After that, we hope to share three or four specific examples demonstrating how Vince and I have utilized New Relic in our actual jobs to inform business decisions, prioritize work, and more. We will also leave plenty of time for questions at the end.
00:03:10.800
New Relic has been around for about six years. It started out as just a Rails performance monitoring tool, but it has expanded substantially since then. We have added a number of different agents, allowing us to work within lots of environments, including Java, .NET, PHP, and Python.
00:03:30.180
We have developed a platform component that allows you to build your own agents to monitor things like MySQL or Memcache. Essentially, if you can write a plugin for it, you can connect it to our infrastructure and have that data reported back to you. Recently, we have begun venturing into mobile apps, providing iOS agents and enhancing our capabilities with JavaScript through the Node.js agent and a new browser JavaScript agent.
00:03:54.600
Thus far, our main focus has transitioned from simple performance monitoring to what we now call software analytics. This shift marks an exciting time for us as we gather to monitor not only how our applications are performing but also the underlying domain information embedded in the software that helps us make better business decisions.
00:04:19.680
Currently, we are progressing even further with our new insights product, which is aimed at raising the level of abstraction above straightforward infrastructure monitoring and technical information. This includes focusing on analyzing entity behaviors rather than solely on the infrastructure running our applications.
00:04:42.780
APM, which stands for Application Performance Monitoring, is a product you might be familiar with. It has evolved from Rails performance monitoring to a broader application performance monitoring tool. In our collection process, we insert an agent into various components depending on whether it's a browser, mobile app, or server. This agent sends data up to the collection tier, where we start correlating and aggregating information and then presenting it in our UI.
00:05:21.240
Historically, APM has been focused on aggregated information rather than collecting raw data. We typically took averages over time and represented the data in aggregate form. However, we are transitioning towards insights that provide event-level resolution. This means we will not be simply aggregating anymore; we will be saving the entire information for complex queries later. This advancement is particularly relevant to both our APM product and our insights capabilities.
00:06:11.280
In this section, I will discuss several new features recently integrated into APM. Given that we are all Ruby developers, I would particularly like to highlight some of the interesting enhancements we've introduced for Ruby 2.1's garbage collection system. Observing these changes within our staging environment, we noticed significant reductions in memory usage, time spent in garbage collection, and overall heap size since upgrading our systems.
00:06:45.300
This is a noteworthy developer insight, and I genuinely encourage you all to consider upgrading to Ruby 2.1 for better performance, especially regarding garbage collection. Another key feature we’ve added is support for histograms and percentiles, allowing us to extract more meaningful insights from the data we collect, rather than relying solely on averages which can often obscure critical details.
00:07:06.780
Like other monitoring tools involved with aggregates, we understand that critical details can often be lost in average-based models. Therefore, we now provide histograms for all the metrics we collect. You’ll be able to identify and analyze transactions, and see where things often experience notable variations—also giving insight into unusual instances that might lead to bottlenecks or performance issues.
00:08:15.720
As for the recent browser monitoring feature, which was released just a month or two ago, we found that many front-end developers needed a tool tailored for that purpose. We’ve broken out browser functionality from APM to create a new tool specifically designed for front-end monitoring. I want to share a specific story from my team regarding what happened when we implemented browser monitoring.
00:08:35.940
Previously, we lacked access to certain data. However, as soon as the browser monitoring feature was released, we were excited to use this new capability. An initial scan revealed that 20 to 30 percent of our page loads were generating JavaScript errors, which was alarming. Most of these issues did not bring down the site, but prompted us to dig deeper into whether there were other more serious errors hidden beneath.
00:09:03.960
Once we began investigating the JavaScript errors, we encountered a breakdown of recurring issues over a specific time period ranked by frequency. Many of these errors, while troubling, pointed out areas needing improvement without necessarily breaking functionality entirely.
00:09:28.620
As we delved into the specifics of the most frequent errors, we discovered that many were apparent only on older browser versions such as Internet Explorer—a clear lesson in ensuring compatibility. Using tools like New Relic, developers can harness vital insights to catch issues we may overlook in the development process, allowing us to enhance user experiences across the board.
00:09:56.520
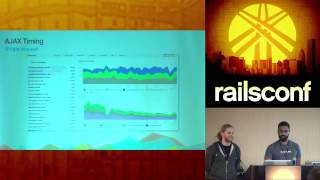
Another exciting feature involves AJAX timing, providing in-depth information about AJAX calls made across your application. With this tool, we gain insights into all AJAX actions occurring on our pages, allowing developers to track timing precisely, and help measure performance bottlenecks.
00:10:25.440
Before ending this section, we’d like to open the floor for any questions you may have about the information we have discussed regarding insights and new data tools.
00:10:47.820
Insights is a brand-new product that we built ground up, introducing a new data collection tier and an innovative user interface. We refer to it as a real-time analytics platform, collecting every event that happens—covering components like page views and transactions within existing agents in applications.
00:11:19.020
Utilizing the information collected thus far, real-time analytics allows us to provide an extremely engaging way of working with our data. Each dashboard segment is backed by a query that resembles SQL, complete with intuitive functions to access counts, averages, and more. We also facilitate the creation of histograms, pie charts, and time series charts all reflecting live data results.
00:11:37.680
By employing real-time queries, you can dynamically generate charts showcasing crucial metrics without needing to run manual analyses continually. With our upcoming advanced features, users can gain compelling insights into their applications, investigating data interactively.
00:12:01.680
Additionally, each piece of information sent to the agent can be integrated into insightful queries. This enables users to perform complex performance analyses, segmenting information to detect significant variables’ effects on application speed.
00:12:31.680
Building custom dashboards with tailored metrics allows for real-time tracking, facilitating monitoring of critical data points based on changes in customer variables or application loads. This kind of detailed data analysis opens doors for better performance optimization strategies.
00:13:03.399
Vince highlighted the importance of tracking host counts and performance evaluations, which are beneficial not only for infrastructure management but also for evaluating database interactions during specific use patterns. Furthermore, we can fine-tune our optimization efforts based on empirical usage data captured from within our tools.
00:13:45.480
As part of our personal example, we wish to share a recent experience that involved launching insights. Our marketing team requested a dashboard displaying user interaction data on insights in real-time, such as how many users logged in and viewed dashboards. After creating this dashboard, it became evident that we needed to enhance its utility by allowing actionable insights for reporting within our marketing automation processes.
00:14:23.820
Based on the insights collected, the marketing team sought ways to export user activities into Marketo, enabling targeted outreach to the right audiences based on their interactions with our application. By centralizing the collected data, we were able to facilitate an efficient background processing architecture that empowers our marketing initiatives with real-time user behavior tracking.
00:14:52.680
In summary of this discussion, we believe this streamlined querying and data integration will further enhance our workflows while ensuring our marketing strategies align effectively with actionable insights derived from user behaviors.
00:15:21.600
If there are any questions about New Relic or insights, feel free to ask us, as we look forward to hearing your thoughts and feedback.
00:15:37.680
Thank you for joining us today!


