00:00:13.070
So today, my name is Koichi Sasada, and I want to talk about what is happening in your Ruby on Rails application. I wanted to use some introspection features of Ruby itself. First, I want to summarize my presentation.
00:00:26.580
I will discuss two main topics. There are many existing tools to inspect your Rails application, and there are also many good resources available online. So please, Google them and check out the resources. In this presentation, I will provide several keywords and also inform you that you can create your own tools using MRI.
00:00:58.289
That is the essence of my topic. As an introduction, I am a member of the American Committee since 2007, and I am here representing Ruby. How many people are still using Ruby 1.8? Only a few? If you are using MRI, then I thank you for using my software.
00:01:24.390
Ruby is built on the virtual machine, which was introduced in Ruby 1.9. Unfortunately, I am not a latest programmer. My wife is a Rails developer, so my wife is my customer in this regard. This is my first time attending RailsConf, and I am very excited to give this talk.
00:02:10.789
I want to express my gratitude to Hiroki, who employed me to help at Layer 3 and Heroku. This afternoon, we will have a sponsor session, so please check out Heroku. Our mission is to ensure that the Ruby language is safe and improves the quality of MRI. Quality can mean various things, including no bugs, performance, and low memory consumption.
00:02:54.310
We are a team of three members, and you may know Matsumoto, the creator of Ruby. I don't need to explain who he is, but he is well-known for holding many titles. Nobu is another very active committer who fixes bugs and introduces improvements. He has been instrumental in the development of Ruby.
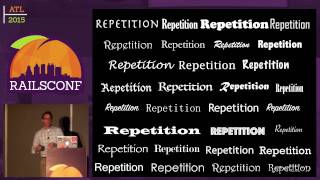
00:03:49.720
This is a vibrant community with many contributors, and we continually see many commits, especially from Nobu. We say he is a 'commit monster.' I am also an internal hacker and a developer. This is a representation of my daily contributions and activities.
00:04:22.230
In terms of events, our recent achievements include the release of Ruby 3.0. However, I will skip discussing everything related to that release because of time constraints. But for those interested, all updates will be available online.
00:05:07.880
For those who are curious about new features of Ruby, I want to highlight performance improvements, particularly for layers programming which some may find easier but often leads to slower execution compared to standard methods.
00:05:27.370
The Ruby community has been working on enhancing performance significantly, and I've seen improvements by about 15 times, although it may still be slower than normal methods.
00:06:00.230
Regarding Ruby 2.3, we are currently working to finalize its features and expect to release it at the end of this year. However, if you have any questions, ideas, or suggestions, please feel free to reach out to me after this presentation.
00:06:43.630
Today’s topic is ‘What’s happening in your Rails application: an Introduction to Introspection features of Ruby.’ This title reflects a diagram created by our talented team member and superhero, Pat.
00:07:18.249
As most of you know, working with Ruby on Rails involves many layers. Your application sits atop many technologies, including hardware, an operating system, the Ruby interpreter, Rails framework, and other gems. Understanding these layers is crucial for resolving issues.
00:07:56.580
Many people might not know how to modify the Linux operating system or how the interpreter works; these are specialized skills that most don't possess. Furthermore, when your application encounters problems, it can feel like a black box.
00:08:37.640
If you're experiencing issues, it is critical to understand what’s happening in your application and computing systems. My answer to this is to use existing tools and to create your own custom tools.
00:09:24.750
First, I want to introduce some existing tools. Thankfully, there are many excellent presentations available. For instance, tomorrow's sessions will cover additional topics that connect to what I'll be discussing.
00:09:51.700
A straightforward method to tackle performance issues involves using performance monitoring tools, particularly on Heroku, which offers robust isolated computing resources. However, this can be costly.
00:10:29.600
If you encounter a slow request, it's necessary to determine where the problem originates: Is it an internal issue, an external API call, or is it tied to garbage collection problems? Understanding the source of slowness is essential to resolving it.
00:11:01.110
Similarly, for memory consumption issues, it’s important to identify which part of the code is consuming the most memory. A helpful service is New Relic, which accurately shows which parts of your requests consume the most time.
00:11:32.720
Using tools like New Relic, you can gather significant insights to help optimize your Ruby application performance more efficiently.
00:12:03.410
I encourage you to consider using various profiling tools available in the community to understand your Rails application better.
00:12:38.900
Garbage collection is a crucial aspect of memory management in Ruby. It automatically recycles unused objects, so you don't have to manage object creation and destruction.
00:13:01.070
However, in Ruby 2.0, incremental garbage collection was implemented, improving how object memory is managed. Understanding these configurations and settings can reveal performance bottlenecks.
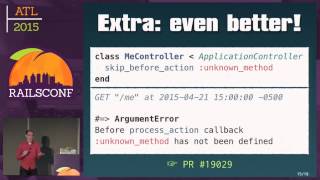
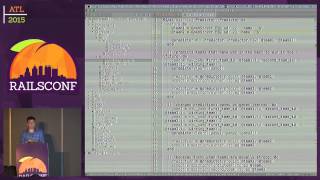
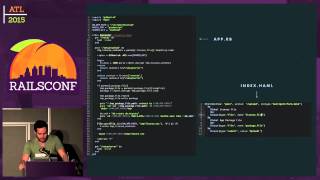
00:13:34.040
To analyze memory consumption more effectively, I want to introduce my own gems that help track garbage collection and object allocation.
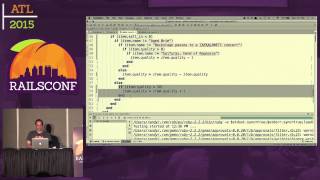
00:14:12.440
For example, one gem is called digit Reza, which is straightforward to use. You only need to require the library and specify a filename to log the information regarding memory allocation.
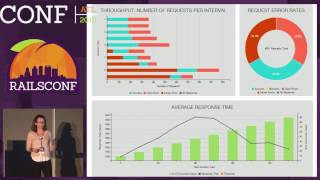
00:14:56.510
This tool provides various insights into your application, which are helpful for analyzing the memory consumption and garbage collection behavior in your Rails apps.
00:15:44.890
It's essential to remember that using an allocation tracer in production can slow down your application, so it’s better to utilize them in a development environment.
00:16:35.980
Through this demonstration, you will notice the impact of enabling certain tracing tools. Keep this in mind when analyzing performance and memory usage.
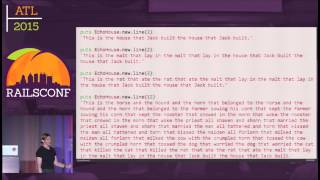
00:17:20.710
You should explore the statistical information gathered by these tools to understand the underlying issues affecting your application's performance.
00:18:05.200
We've discussed various tools to help analyze garbage collection and memory issues in your Ruby application, enabling you to tune performance more effectively.
00:18:46.420
For instance, you might face challenges related to memory without any obvious reasons. It's important to understand that while I can’t magically resolve these problems, using these tools will provide insights.
00:19:30.080
We must focus on memory management and how garbage collection works within your application. Keep track of allocated objects and understand the ramifications of not managing memory effectively.
00:20:18.510
Finally, I want to share that if you have any issues with memory or performance in your Rails application, I am here to assist you. Please feel free to ask about any concerns you might have.
00:20:57.150
Performance profiling is essential, and I recommend trying both built-in and third-party tools to monitor your Ruby applications effectively.
00:21:35.840
In closing, I hope that you find the introspection features of Ruby useful in your Rails applications, and don’t hesitate to reach out for further assistance.
00:22:07.019
Thank you so much for your attention!